Australian vs White/Caucasian Bachelor's Degree
COMPARE
Australian
White/Caucasian
Bachelor's Degree
Bachelor's Degree Comparison
Australians
Whites/Caucasians
44.0%
BACHELOR'S DEGREE
99.9/ 100
METRIC RATING
59th/ 347
METRIC RANK
35.3%
BACHELOR'S DEGREE
5.9/ 100
METRIC RATING
229th/ 347
METRIC RANK
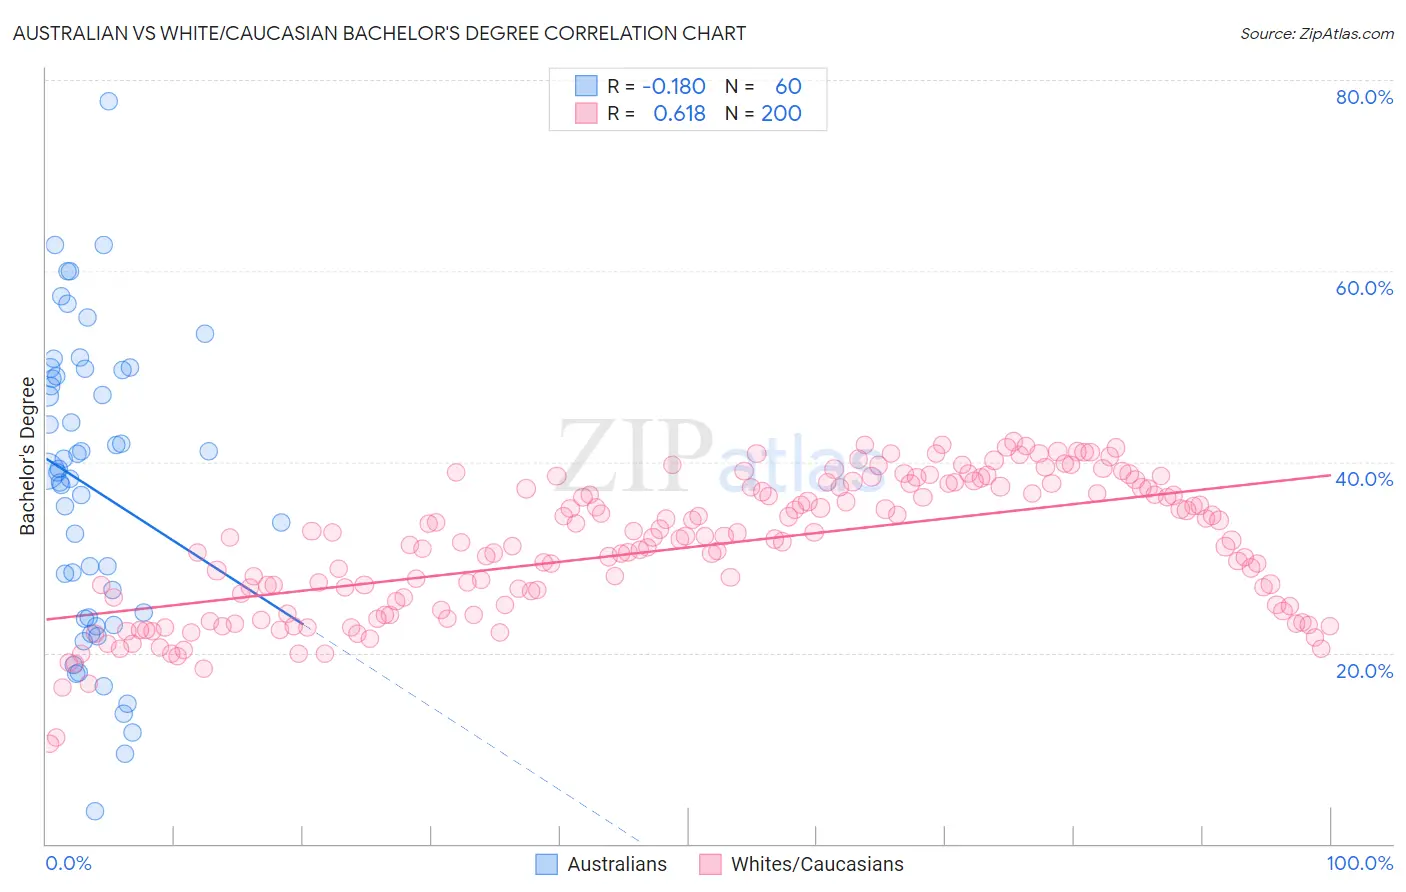
Australian vs White/Caucasian Bachelor's Degree Correlation Chart
The statistical analysis conducted on geographies consisting of 224,140,970 people shows a poor negative correlation between the proportion of Australians and percentage of population with at least bachelor's degree education in the United States with a correlation coefficient (R) of -0.180 and weighted average of 44.0%. Similarly, the statistical analysis conducted on geographies consisting of 584,716,229 people shows a significant positive correlation between the proportion of Whites/Caucasians and percentage of population with at least bachelor's degree education in the United States with a correlation coefficient (R) of 0.618 and weighted average of 35.3%, a difference of 24.7%.
Bachelor's Degree Correlation Summary
| Measurement | Australian | White/Caucasian |
| Minimum | 3.4% | 10.4% |
| Maximum | 77.7% | 42.1% |
| Range | 74.3% | 31.7% |
| Mean | 37.3% | 31.0% |
| Median | 38.9% | 31.9% |
| Interquartile 25% (IQ1) | 23.7% | 24.9% |
| Interquartile 75% (IQ3) | 49.3% | 37.3% |
| Interquartile Range (IQR) | 25.7% | 12.4% |
| Standard Deviation (Sample) | 15.6% | 7.1% |
| Standard Deviation (Population) | 15.5% | 7.1% |
Similar Demographics by Bachelor's Degree
Demographics Similar to Australians by Bachelor's Degree
In terms of bachelor's degree, the demographic groups most similar to Australians are New Zealander (44.0%, a difference of 0.010%), Immigrants from Czechoslovakia (44.0%, a difference of 0.10%), Paraguayan (44.0%, a difference of 0.16%), Immigrants from Serbia (44.1%, a difference of 0.34%), and Immigrants from Austria (44.2%, a difference of 0.53%).
| Demographics | Rating | Rank | Bachelor's Degree |
| Immigrants | Spain | 99.9 /100 | #52 | Exceptional 44.3% |
| Immigrants | Asia | 99.9 /100 | #53 | Exceptional 44.3% |
| Immigrants | Austria | 99.9 /100 | #54 | Exceptional 44.2% |
| Immigrants | Bolivia | 99.9 /100 | #55 | Exceptional 44.2% |
| Immigrants | Serbia | 99.9 /100 | #56 | Exceptional 44.1% |
| Paraguayans | 99.9 /100 | #57 | Exceptional 44.0% |
| Immigrants | Czechoslovakia | 99.9 /100 | #58 | Exceptional 44.0% |
| Australians | 99.9 /100 | #59 | Exceptional 44.0% |
| New Zealanders | 99.9 /100 | #60 | Exceptional 44.0% |
| South Africans | 99.8 /100 | #61 | Exceptional 43.6% |
| Immigrants | Kazakhstan | 99.8 /100 | #62 | Exceptional 43.4% |
| Immigrants | Europe | 99.8 /100 | #63 | Exceptional 43.4% |
| Argentineans | 99.7 /100 | #64 | Exceptional 43.3% |
| Zimbabweans | 99.7 /100 | #65 | Exceptional 43.3% |
| Immigrants | Netherlands | 99.7 /100 | #66 | Exceptional 43.3% |
Demographics Similar to Whites/Caucasians by Bachelor's Degree
In terms of bachelor's degree, the demographic groups most similar to Whites/Caucasians are Immigrants from Trinidad and Tobago (35.3%, a difference of 0.080%), Ecuadorian (35.4%, a difference of 0.31%), Portuguese (35.5%, a difference of 0.57%), Immigrants from Burma/Myanmar (35.5%, a difference of 0.61%), and Immigrants from Barbados (35.5%, a difference of 0.68%).
| Demographics | Rating | Rank | Bachelor's Degree |
| Trinidadians and Tobagonians | 8.8 /100 | #222 | Tragic 35.7% |
| French Canadians | 8.3 /100 | #223 | Tragic 35.6% |
| Immigrants | Barbados | 7.5 /100 | #224 | Tragic 35.5% |
| Immigrants | Burma/Myanmar | 7.3 /100 | #225 | Tragic 35.5% |
| Portuguese | 7.2 /100 | #226 | Tragic 35.5% |
| Ecuadorians | 6.6 /100 | #227 | Tragic 35.4% |
| Immigrants | Trinidad and Tobago | 6.0 /100 | #228 | Tragic 35.3% |
| Whites/Caucasians | 5.9 /100 | #229 | Tragic 35.3% |
| Immigrants | Grenada | 4.3 /100 | #230 | Tragic 35.0% |
| Immigrants | St. Vincent and the Grenadines | 4.3 /100 | #231 | Tragic 35.0% |
| Hmong | 3.4 /100 | #232 | Tragic 34.8% |
| Immigrants | Ecuador | 3.3 /100 | #233 | Tragic 34.7% |
| Guamanians/Chamorros | 3.0 /100 | #234 | Tragic 34.6% |
| Immigrants | West Indies | 2.9 /100 | #235 | Tragic 34.6% |
| Liberians | 2.8 /100 | #236 | Tragic 34.6% |