Australian vs Arab Nursery School
COMPARE
Australian
Arab
Nursery School
Nursery School Comparison
Australians
Arabs
98.5%
NURSERY SCHOOL
99.8/ 100
METRIC RATING
52nd/ 347
METRIC RANK
97.9%
NURSERY SCHOOL
34.7/ 100
METRIC RATING
188th/ 347
METRIC RANK
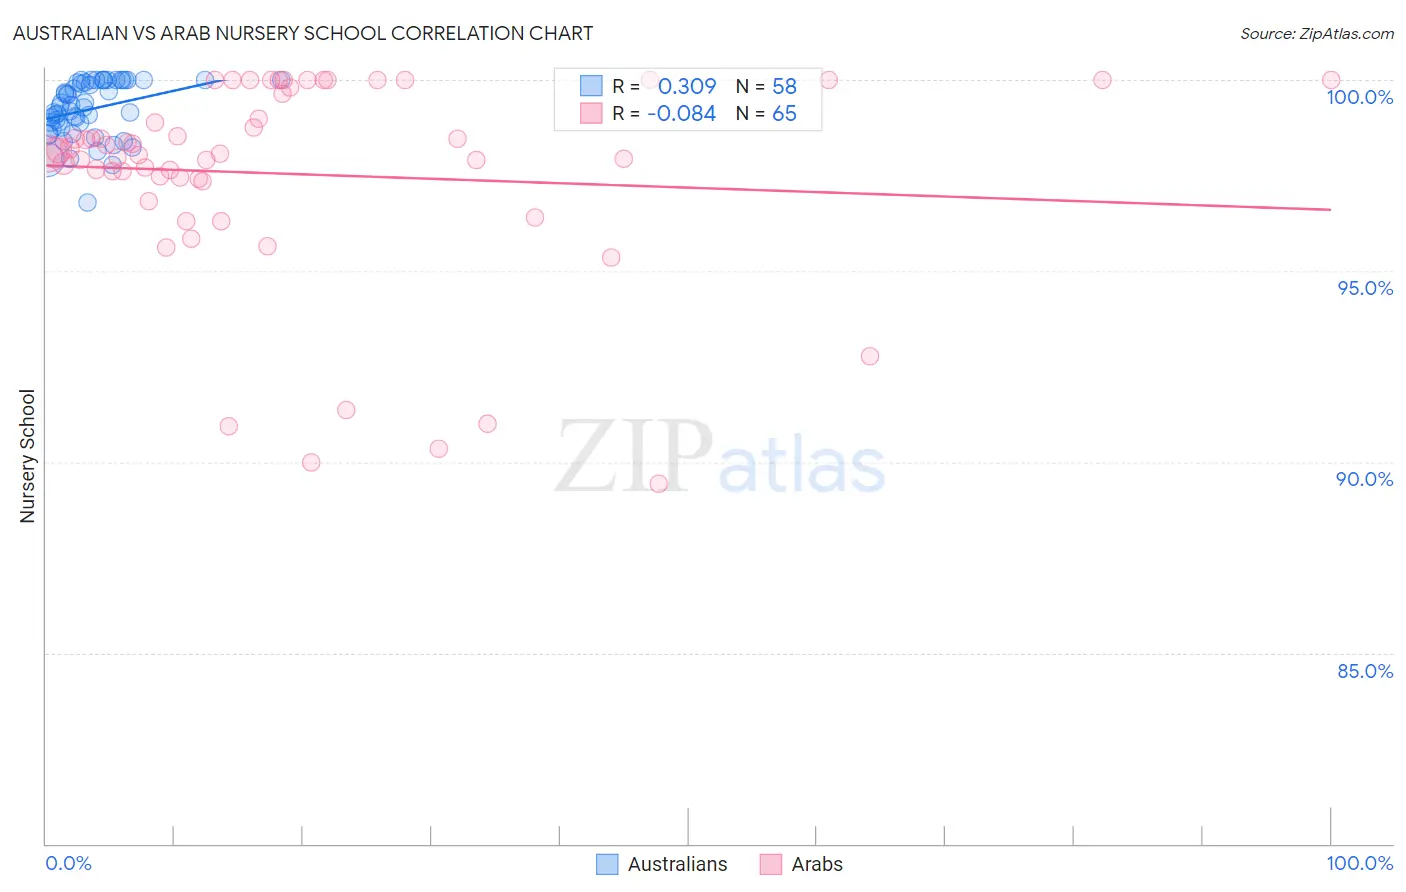
Australian vs Arab Nursery School Correlation Chart
The statistical analysis conducted on geographies consisting of 224,153,392 people shows a mild positive correlation between the proportion of Australians and percentage of population with at least nursery school education in the United States with a correlation coefficient (R) of 0.309 and weighted average of 98.5%. Similarly, the statistical analysis conducted on geographies consisting of 486,872,066 people shows a slight negative correlation between the proportion of Arabs and percentage of population with at least nursery school education in the United States with a correlation coefficient (R) of -0.084 and weighted average of 97.9%, a difference of 0.53%.
Nursery School Correlation Summary
| Measurement | Australian | Arab |
| Minimum | 96.8% | 89.4% |
| Maximum | 100.0% | 100.0% |
| Range | 3.2% | 10.6% |
| Mean | 99.2% | 97.5% |
| Median | 99.3% | 98.1% |
| Interquartile 25% (IQ1) | 98.8% | 97.4% |
| Interquartile 75% (IQ3) | 100.0% | 99.7% |
| Interquartile Range (IQR) | 1.2% | 2.3% |
| Standard Deviation (Sample) | 0.74% | 2.7% |
| Standard Deviation (Population) | 0.73% | 2.7% |
Similar Demographics by Nursery School
Demographics Similar to Australians by Nursery School
In terms of nursery school, the demographic groups most similar to Australians are White/Caucasian (98.5%, a difference of 0.0%), Celtic (98.5%, a difference of 0.0%), Estonian (98.5%, a difference of 0.0%), Czechoslovakian (98.5%, a difference of 0.010%), and Ottawa (98.5%, a difference of 0.010%).
| Demographics | Rating | Rank | Nursery School |
| Northern Europeans | 99.9 /100 | #45 | Exceptional 98.5% |
| Hungarians | 99.9 /100 | #46 | Exceptional 98.5% |
| Czechoslovakians | 99.9 /100 | #47 | Exceptional 98.5% |
| Ottawa | 99.8 /100 | #48 | Exceptional 98.5% |
| Whites/Caucasians | 99.8 /100 | #49 | Exceptional 98.5% |
| Celtics | 99.8 /100 | #50 | Exceptional 98.5% |
| Estonians | 99.8 /100 | #51 | Exceptional 98.5% |
| Australians | 99.8 /100 | #52 | Exceptional 98.5% |
| Kiowa | 99.8 /100 | #53 | Exceptional 98.4% |
| Pueblo | 99.8 /100 | #54 | Exceptional 98.4% |
| Immigrants | Scotland | 99.8 /100 | #55 | Exceptional 98.4% |
| Americans | 99.8 /100 | #56 | Exceptional 98.4% |
| Austrians | 99.8 /100 | #57 | Exceptional 98.4% |
| Bulgarians | 99.8 /100 | #58 | Exceptional 98.4% |
| Immigrants | Canada | 99.8 /100 | #59 | Exceptional 98.4% |
Demographics Similar to Arabs by Nursery School
In terms of nursery school, the demographic groups most similar to Arabs are Pakistani (97.9%, a difference of 0.0%), Panamanian (97.9%, a difference of 0.0%), Immigrants from Kazakhstan (97.9%, a difference of 0.010%), Immigrants from Taiwan (97.9%, a difference of 0.010%), and Paiute (98.0%, a difference of 0.020%).
| Demographics | Rating | Rank | Nursery School |
| Egyptians | 42.8 /100 | #181 | Average 98.0% |
| Paiute | 42.0 /100 | #182 | Average 98.0% |
| Portuguese | 41.8 /100 | #183 | Average 98.0% |
| Immigrants | Poland | 41.3 /100 | #184 | Average 98.0% |
| Immigrants | Belarus | 41.0 /100 | #185 | Average 98.0% |
| Immigrants | Argentina | 40.8 /100 | #186 | Average 98.0% |
| Immigrants | Kazakhstan | 37.1 /100 | #187 | Fair 97.9% |
| Arabs | 34.7 /100 | #188 | Fair 97.9% |
| Pakistanis | 34.6 /100 | #189 | Fair 97.9% |
| Panamanians | 34.3 /100 | #190 | Fair 97.9% |
| Immigrants | Taiwan | 30.6 /100 | #191 | Fair 97.9% |
| Blacks/African Americans | 29.4 /100 | #192 | Fair 97.9% |
| Paraguayans | 27.4 /100 | #193 | Fair 97.9% |
| Mongolians | 27.3 /100 | #194 | Fair 97.9% |
| Hawaiians | 27.2 /100 | #195 | Fair 97.9% |