Assyrian/Chaldean/Syriac vs Dutch Associate's Degree

COMPARE

Assyrian/Chaldean/Syriac
Race
Ancestry
AfghanAfricanAlaska NativeAlaskan AthabascanAlbanianAleutAlsatianAmericanApacheArabArapahoArgentineanArmenianAssyrian/Chaldean/SyriacAustralianAustrianBahamianBangladeshiBarbadianBasqueBelgianBelizeanBermudanBhutaneseBlackfeetBolivianBrazilianBritishBritish West IndianBulgarianBurmeseCajunCambodianCanadianCape VerdeanCarpatho RusynCelticCentral AmericanCentral American IndianCherokeeCheyenneChickasawChileanChineseChippewaChoctawColombianColvilleComancheCosta RicanCreeCreekCroatianCrowCubanCypriotCzechCzechoslovakianDanishDelawareDominicanDutch West IndianEastern EuropeanEcuadorianEgyptianEnglishEstonianEthiopianEuropeanFijianFilipinoFinnishFrenchFrench American IndianFrench CanadianGermanGerman RussianGhanaianGreekGuamanian/ChamorroGuatemalanGuyaneseHaitianHmongHonduranHopiHoumaHungarianIcelanderIndian (Asian)IndonesianInupiatIranianIraqiIrishIroquoisIsraeliItalianJamaicanJapaneseJordanianKenyanKiowaKoreanLaotianLatvianLebaneseLiberianLithuanianLumbeeLuxembourgerMacedonianMalaysianMalteseMarshalleseMenomineeMexicanMexican American IndianMongolianMoroccanNative HawaiianNavajoNepaleseNew ZealanderNicaraguanNigerianNorthern EuropeanNorwegianOkinawanOsageOttawaPaiutePakistaniPalestinianPanamanianParaguayanPennsylvania GermanPeruvianPimaPolishPortuguesePotawatomiPuebloPuerto RicanPuget Sound SalishRomanianRussianSalvadoranSamoanScandinavianScotch-IrishScottishSeminoleSenegaleseSerbianShoshoneSierra LeoneanSiouxSlavicSlovakSloveneSomaliSouth AfricanSouth AmericanSouth American IndianSoviet UnionSpaniardSpanishSpanish AmericanSpanish American IndianSri LankanSubsaharan AfricanSudaneseSwedishSwissSyrianTaiwaneseThaiTlingit-HaidaTohono O'OdhamTonganTrinidadian and TobagonianTsimshianTurkishU.S. Virgin IslanderUgandanUkrainianUruguayanUteVenezuelanVietnameseWelshWest IndianYakamaYaquiYugoslavianYumanYup'ikZimbabwean
Immigration
NonimmigrantsImmigrantsAfghanistanAfricaAlbaniaArgentinaArmeniaAsiaAustraliaAustriaBahamasBangladeshBarbadosBelarusBelgiumBelizeBoliviaBosnia and HerzegovinaBrazilBulgariaBurma/MyanmarCabo VerdeCambodiaCameroonCanadaCaribbeanCentral AmericaChileChinaColombiaCongoCosta RicaCroatiaCubaCzechoslovakiaDenmarkDominicaDominican RepublicEastern AfricaEastern AsiaEastern EuropeEcuadorEgyptEl SalvadorEnglandEritreaEthiopiaEuropeFijiFranceGermanyGhanaGreeceGrenadaGuatemalaGuyanaHaitiHondurasHong KongHungaryIndiaIndonesiaIranIraqIrelandIsraelItalyJamaicaJapanJordanKazakhstanKenyaKoreaKuwaitLaosLatin AmericaLatviaLebanonLiberiaLithuaniaMalaysiaMexicoMicronesiaMiddle AfricaMoldovaMoroccoNepalNetherlandsNicaraguaNigeriaNorth AmericaNorth MacedoniaNorthern AfricaNorthern EuropeNorwayOceaniaPakistanPanamaPeruPhilippinesPolandPortugalRomaniaRussiaSaudi ArabiaScotlandSenegalSerbiaSierra LeoneSingaporeSomaliaSouth AfricaSouth AmericaSouth Central AsiaSouth Eastern AsiaSouthern EuropeSpainSri LankaSt. Vincent and the GrenadinesSudanSwedenSwitzerlandSyriaTaiwanThailandTrinidad and TobagoTurkeyUgandaUkraineUruguayUzbekistanVenezuelaVietnamWest IndiesWestern AfricaWestern AsiaWestern EuropeYemenZaireZimbabweAzores
Dutch
Race
Ancestry
AfghanAfricanAlaska NativeAlaskan AthabascanAlbanianAleutAlsatianAmericanApacheArabArapahoArgentineanArmenianAustralianAustrianBahamianBangladeshiBarbadianBasqueBelgianBelizeanBermudanBhutaneseBlackfeetBolivianBrazilianBritishBritish West IndianBulgarianBurmeseCajunCambodianCanadianCape VerdeanCarpatho RusynCelticCentral AmericanCentral American IndianCherokeeCheyenneChickasawChileanChineseChippewaChoctawColombianColvilleComancheCosta RicanCreeCreekCroatianCrowCubanCypriotCzechCzechoslovakianDanishDelawareDominicanDutchDutch West IndianEastern EuropeanEcuadorianEgyptianEnglishEstonianEthiopianEuropeanFijianFilipinoFinnishFrenchFrench American IndianFrench CanadianGermanGerman RussianGhanaianGreekGuamanian/ChamorroGuatemalanGuyaneseHaitianHmongHonduranHopiHoumaHungarianIcelanderIndian (Asian)IndonesianInupiatIranianIraqiIrishIroquoisIsraeliItalianJamaicanJapaneseJordanianKenyanKiowaKoreanLaotianLatvianLebaneseLiberianLithuanianLumbeeLuxembourgerMacedonianMalaysianMalteseMarshalleseMenomineeMexicanMexican American IndianMongolianMoroccanNative HawaiianNavajoNepaleseNew ZealanderNicaraguanNigerianNorthern EuropeanNorwegianOkinawanOsageOttawaPaiutePakistaniPalestinianPanamanianParaguayanPennsylvania GermanPeruvianPimaPolishPortuguesePotawatomiPuebloPuerto RicanPuget Sound SalishRomanianRussianSalvadoranSamoanScandinavianScotch-IrishScottishSeminoleSenegaleseSerbianShoshoneSierra LeoneanSiouxSlavicSlovakSloveneSomaliSouth AfricanSouth AmericanSouth American IndianSoviet UnionSpaniardSpanishSpanish AmericanSpanish American IndianSri LankanSubsaharan AfricanSudaneseSwedishSwissSyrianTaiwaneseThaiTlingit-HaidaTohono O'OdhamTonganTrinidadian and TobagonianTsimshianTurkishU.S. Virgin IslanderUgandanUkrainianUruguayanUteVenezuelanVietnameseWelshWest IndianYakamaYaquiYugoslavianYumanYup'ikZimbabwean
Immigration
NonimmigrantsImmigrantsAfghanistanAfricaAlbaniaArgentinaArmeniaAsiaAustraliaAustriaBahamasBangladeshBarbadosBelarusBelgiumBelizeBoliviaBosnia and HerzegovinaBrazilBulgariaBurma/MyanmarCabo VerdeCambodiaCameroonCanadaCaribbeanCentral AmericaChileChinaColombiaCongoCosta RicaCroatiaCubaCzechoslovakiaDenmarkDominicaDominican RepublicEastern AfricaEastern AsiaEastern EuropeEcuadorEgyptEl SalvadorEnglandEritreaEthiopiaEuropeFijiFranceGermanyGhanaGreeceGrenadaGuatemalaGuyanaHaitiHondurasHong KongHungaryIndiaIndonesiaIranIraqIrelandIsraelItalyJamaicaJapanJordanKazakhstanKenyaKoreaKuwaitLaosLatin AmericaLatviaLebanonLiberiaLithuaniaMalaysiaMexicoMicronesiaMiddle AfricaMoldovaMoroccoNepalNetherlandsNicaraguaNigeriaNorth AmericaNorth MacedoniaNorthern AfricaNorthern EuropeNorwayOceaniaPakistanPanamaPeruPhilippinesPolandPortugalRomaniaRussiaSaudi ArabiaScotlandSenegalSerbiaSierra LeoneSingaporeSomaliaSouth AfricaSouth AmericaSouth Central AsiaSouth Eastern AsiaSouthern EuropeSpainSri LankaSt. Vincent and the GrenadinesSudanSwedenSwitzerlandSyriaTaiwanThailandTrinidad and TobagoTurkeyUgandaUkraineUruguayUzbekistanVenezuelaVietnamWest IndiesWestern AfricaWestern AsiaWestern EuropeYemenZaireZimbabweAzores
Associate's Degree
Income
Poverty
Unemployment
Labor Participation
Family Structure
Vehicle Availability
Education Level
Disability

Associate's Degree Comparison

Assyrians/Chaldeans/Syriacs

Dutch

Excellent
Poor
48.2%
ASSOCIATE'S DEGREE
89.4/ 100
METRIC RATING
133rd/ 347
METRIC RANK
45.0%
ASSOCIATE'S DEGREE
17.6/ 100
METRIC RATING
208th/ 347
METRIC RANK

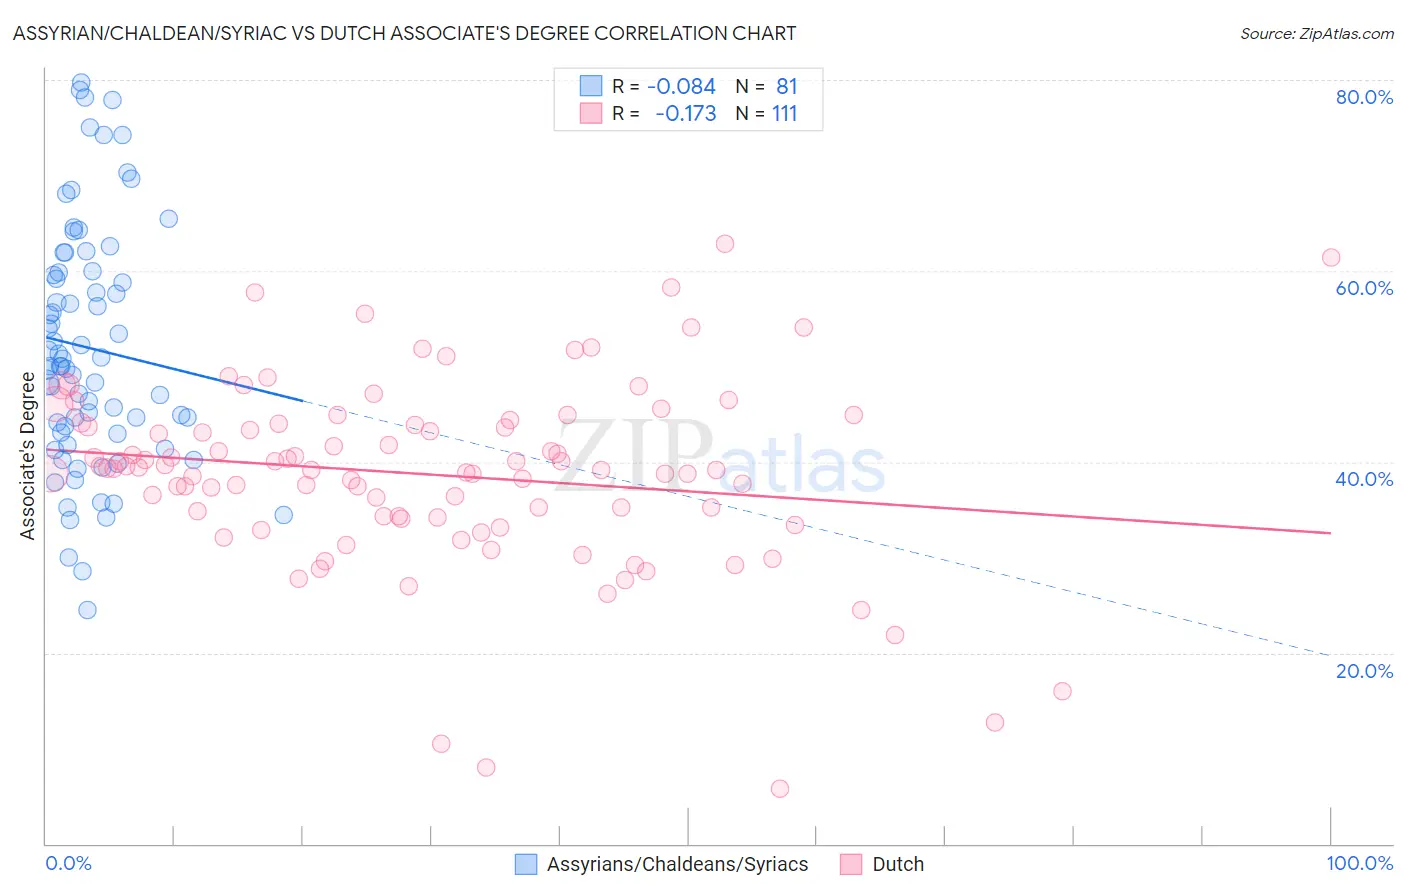
Assyrian/Chaldean/Syriac vs Dutch Associate's Degree Correlation Chart

The statistical analysis conducted on geographies consisting of 110,318,304 people shows a slight negative correlation between the proportion of Assyrians/Chaldeans/Syriacs and percentage of population with at least associate's degree education in the United States with a correlation coefficient (R) of -0.084 and weighted average of 48.2%. Similarly, the statistical analysis conducted on geographies consisting of 554,303,410 people shows a poor negative correlation between the proportion of Dutch and percentage of population with at least associate's degree education in the United States with a correlation coefficient (R) of -0.173 and weighted average of 45.0%, a difference of 7.1%.
Assyrian/Chaldean/Syriac vs Dutch Associate's Degree

Associate's Degree Correlation Summary

MeasurementAssyrian/Chaldean/SyriacDutch
Minimum24.5%5.7%
Maximum79.8%62.9%
Range55.3%57.2%
Mean51.9%38.7%
Median50.1%39.3%
Interquartile 25% (IQ1)43.0%34.2%
Interquartile 75% (IQ3)59.9%43.9%
Interquartile Range (IQR)16.9%9.8%
Standard Deviation (Sample)12.7%9.9%
Standard Deviation (Population)12.6%9.8%

Similar Demographics by Associate's Degree

Demographics Similar to Assyrians/Chaldeans/Syriacs by Associate's Degree

In terms of associate's degree, the demographic groups most similar to Assyrians/Chaldeans/Syriacs are Moroccan (48.2%, a difference of 0.020%), Immigrants from Albania (48.2%, a difference of 0.080%), European (48.2%, a difference of 0.080%), Pakistani (48.1%, a difference of 0.26%), and Icelander (48.3%, a difference of 0.27%).
DemographicsRating | RankAssociate's Degree
Immigrants | Syria
92.2
/100
|
#126
Exceptional
48.5%
Immigrants | Uganda
92.1
/100
|
#127
Exceptional
48.5%
Immigrants | Eastern Africa
91.6
/100
|
#128
Exceptional
48.4%
Swedes
91.5
/100
|
#129
Exceptional
48.4%
Immigrants | Jordan
91.2
/100
|
#130
Exceptional
48.4%
Icelanders
90.8
/100
|
#131
Exceptional
48.3%
Immigrants | Albania
89.9
/100
|
#132
Excellent
48.2%
Assyrians/Chaldeans/Syriacs
89.4
/100
|
#133
Excellent
48.2%
Moroccans
89.3
/100
|
#134
Excellent
48.2%
Europeans
89.0
/100
|
#135
Excellent
48.2%
Pakistanis
88.0
/100
|
#136
Excellent
48.1%
Immigrants | Eritrea
87.8
/100
|
#137
Excellent
48.1%
Poles
87.3
/100
|
#138
Excellent
48.0%
Slovenes
85.1
/100
|
#139
Excellent
47.9%
Immigrants | Southern Europe
84.4
/100
|
#140
Excellent
47.8%

Demographics Similar to Dutch by Associate's Degree

In terms of associate's degree, the demographic groups most similar to Dutch are Panamanian (45.1%, a difference of 0.10%), Immigrants from Costa Rica (45.0%, a difference of 0.11%), Immigrants from Philippines (45.0%, a difference of 0.12%), Immigrants from Zaire (45.0%, a difference of 0.13%), and Immigrants from Thailand (45.1%, a difference of 0.17%).
DemographicsRating | RankAssociate's Degree
Immigrants | Vietnam
20.8
/100
|
#201
Fair
45.2%
Spaniards
20.4
/100
|
#202
Fair
45.2%
Immigrants | South Eastern Asia
20.2
/100
|
#203
Fair
45.2%
Nigerians
19.1
/100
|
#204
Poor
45.1%
Immigrants | Thailand
18.9
/100
|
#205
Poor
45.1%
German Russians
18.9
/100
|
#206
Poor
45.1%
Panamanians
18.4
/100
|
#207
Poor
45.1%
Dutch
17.6
/100
|
#208
Poor
45.0%
Immigrants | Costa Rica
16.7
/100
|
#209
Poor
45.0%
Immigrants | Philippines
16.7
/100
|
#210
Poor
45.0%
Immigrants | Zaire
16.6
/100
|
#211
Poor
45.0%
French Canadians
15.0
/100
|
#212
Poor
44.9%
Immigrants | Ghana
14.2
/100
|
#213
Poor
44.8%
Immigrants | Middle Africa
12.7
/100
|
#214
Poor
44.7%
Immigrants | Panama
12.4
/100
|
#215
Poor
44.7%