Asian vs Alaska Native Nursery School
COMPARE
Asian
Alaska Native
Nursery School
Nursery School Comparison
Asians
Alaska Natives
97.6%
NURSERY SCHOOL
1.1/ 100
METRIC RATING
243rd/ 347
METRIC RANK
98.8%
NURSERY SCHOOL
100.0/ 100
METRIC RATING
7th/ 347
METRIC RANK
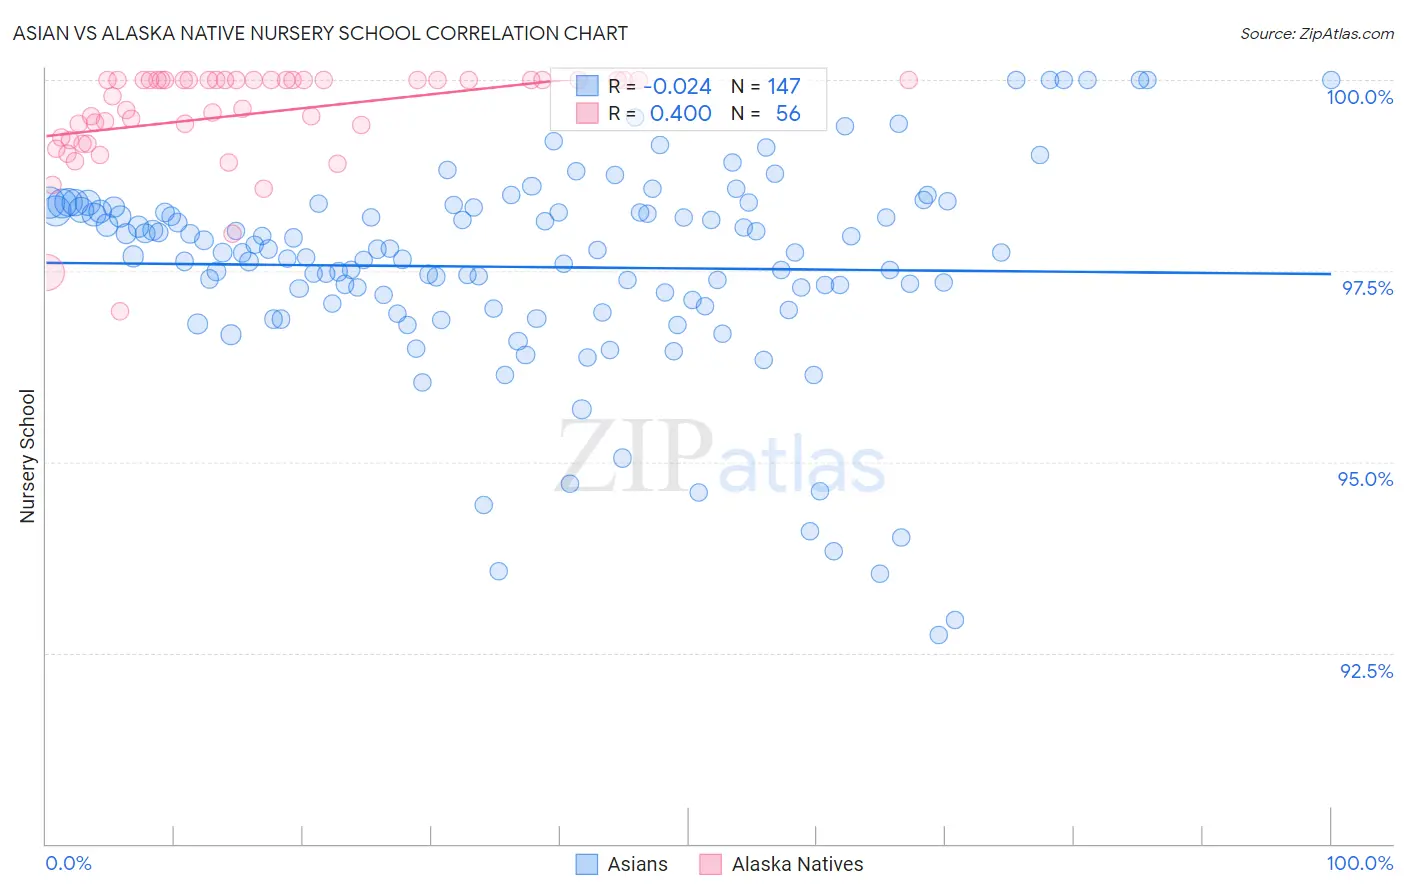
Asian vs Alaska Native Nursery School Correlation Chart
The statistical analysis conducted on geographies consisting of 550,722,447 people shows no correlation between the proportion of Asians and percentage of population with at least nursery school education in the United States with a correlation coefficient (R) of -0.024 and weighted average of 97.6%. Similarly, the statistical analysis conducted on geographies consisting of 76,775,518 people shows a moderate positive correlation between the proportion of Alaska Natives and percentage of population with at least nursery school education in the United States with a correlation coefficient (R) of 0.400 and weighted average of 98.8%, a difference of 1.1%.
Nursery School Correlation Summary
| Measurement | Asian | Alaska Native |
| Minimum | 92.7% | 97.0% |
| Maximum | 100.0% | 100.0% |
| Range | 7.3% | 3.0% |
| Mean | 97.6% | 99.5% |
| Median | 97.7% | 100.0% |
| Interquartile 25% (IQ1) | 97.0% | 99.2% |
| Interquartile 75% (IQ3) | 98.3% | 100.0% |
| Interquartile Range (IQR) | 1.3% | 0.77% |
| Standard Deviation (Sample) | 1.4% | 0.66% |
| Standard Deviation (Population) | 1.4% | 0.65% |
Similar Demographics by Nursery School
Demographics Similar to Asians by Nursery School
In terms of nursery school, the demographic groups most similar to Asians are Liberian (97.7%, a difference of 0.0%), South American (97.6%, a difference of 0.0%), Bolivian (97.6%, a difference of 0.0%), Immigrants from Indonesia (97.7%, a difference of 0.010%), and Peruvian (97.6%, a difference of 0.010%).
| Demographics | Rating | Rank | Nursery School |
| Immigrants | Malaysia | 1.9 /100 | #236 | Tragic 97.7% |
| Immigrants | Western Asia | 1.9 /100 | #237 | Tragic 97.7% |
| Nigerians | 1.7 /100 | #238 | Tragic 97.7% |
| Immigrants | Eastern Asia | 1.6 /100 | #239 | Tragic 97.7% |
| Koreans | 1.4 /100 | #240 | Tragic 97.7% |
| Immigrants | Indonesia | 1.1 /100 | #241 | Tragic 97.7% |
| Liberians | 1.1 /100 | #242 | Tragic 97.7% |
| Asians | 1.1 /100 | #243 | Tragic 97.6% |
| South Americans | 1.0 /100 | #244 | Tragic 97.6% |
| Bolivians | 1.0 /100 | #245 | Tragic 97.6% |
| Peruvians | 1.0 /100 | #246 | Tragic 97.6% |
| Immigrants | Middle Africa | 0.9 /100 | #247 | Tragic 97.6% |
| Indians (Asian) | 0.9 /100 | #248 | Tragic 97.6% |
| Immigrants | Eastern Africa | 0.9 /100 | #249 | Tragic 97.6% |
| Immigrants | Senegal | 0.9 /100 | #250 | Tragic 97.6% |
Demographics Similar to Alaska Natives by Nursery School
In terms of nursery school, the demographic groups most similar to Alaska Natives are Norwegian (98.7%, a difference of 0.020%), Alaskan Athabascan (98.8%, a difference of 0.030%), Slovak (98.7%, a difference of 0.030%), German (98.7%, a difference of 0.040%), and Tlingit-Haida (98.7%, a difference of 0.040%).
| Demographics | Rating | Rank | Nursery School |
| Crow | 100.0 /100 | #1 | Exceptional 99.7% |
| Yup'ik | 100.0 /100 | #2 | Exceptional 99.2% |
| Welsh | 100.0 /100 | #3 | Exceptional 98.9% |
| Inupiat | 100.0 /100 | #4 | Exceptional 98.9% |
| Tsimshian | 100.0 /100 | #5 | Exceptional 98.9% |
| Alaskan Athabascans | 100.0 /100 | #6 | Exceptional 98.8% |
| Alaska Natives | 100.0 /100 | #7 | Exceptional 98.8% |
| Norwegians | 100.0 /100 | #8 | Exceptional 98.7% |
| Slovaks | 100.0 /100 | #9 | Exceptional 98.7% |
| Germans | 100.0 /100 | #10 | Exceptional 98.7% |
| Tlingit-Haida | 100.0 /100 | #11 | Exceptional 98.7% |
| Slovenes | 100.0 /100 | #12 | Exceptional 98.7% |
| English | 100.0 /100 | #13 | Exceptional 98.7% |
| Carpatho Rusyns | 100.0 /100 | #14 | Exceptional 98.7% |
| Swedes | 100.0 /100 | #15 | Exceptional 98.7% |