Armenian vs Lebanese Nursery School
COMPARE
Armenian
Lebanese
Nursery School
Nursery School Comparison
Armenians
Lebanese
97.6%
NURSERY SCHOOL
0.4/ 100
METRIC RATING
259th/ 347
METRIC RANK
98.2%
NURSERY SCHOOL
93.8/ 100
METRIC RATING
124th/ 347
METRIC RANK
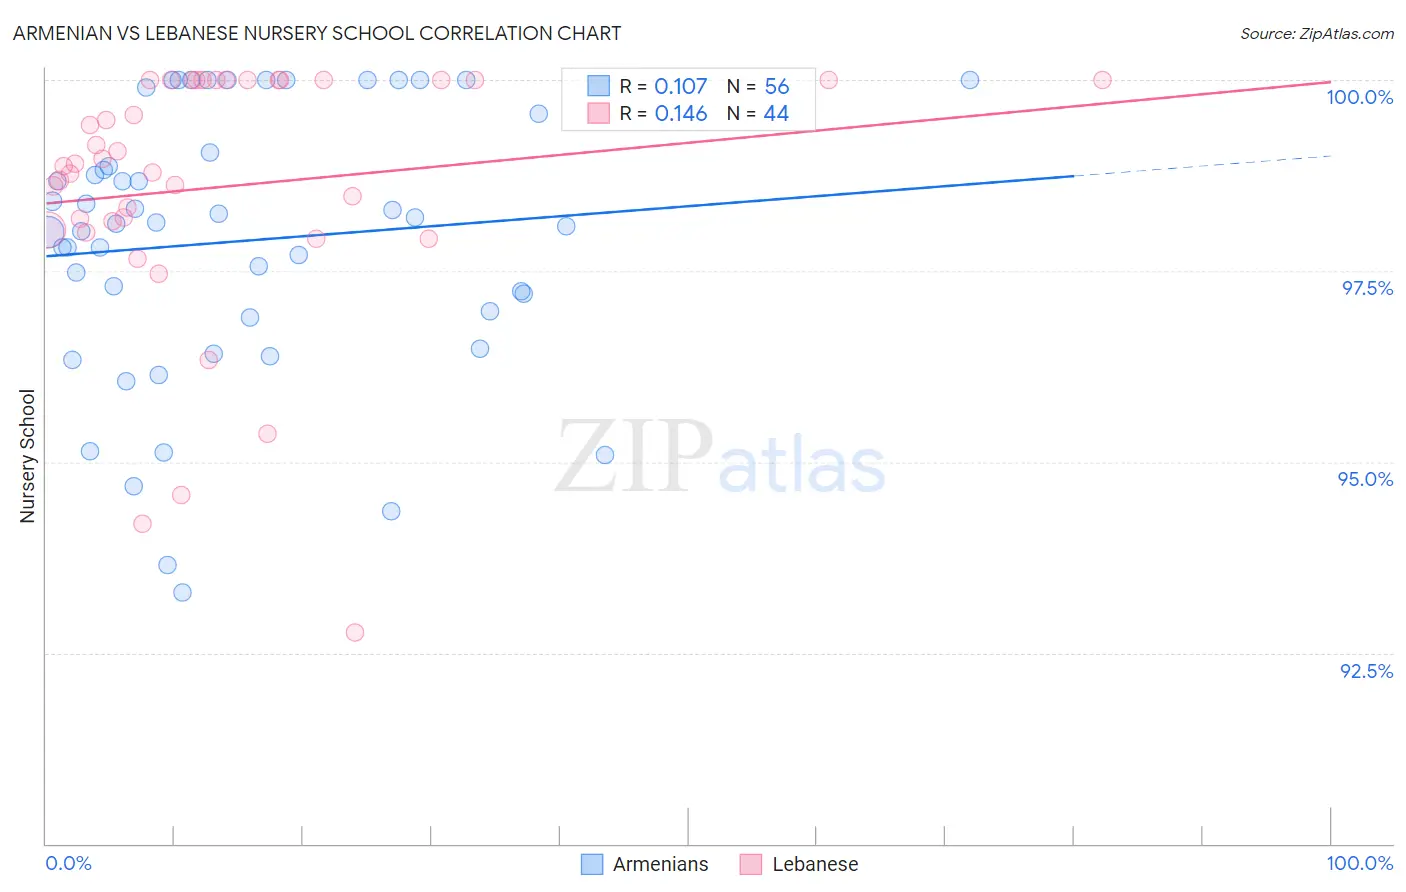
Armenian vs Lebanese Nursery School Correlation Chart
The statistical analysis conducted on geographies consisting of 310,954,660 people shows a poor positive correlation between the proportion of Armenians and percentage of population with at least nursery school education in the United States with a correlation coefficient (R) of 0.107 and weighted average of 97.6%. Similarly, the statistical analysis conducted on geographies consisting of 401,624,157 people shows a poor positive correlation between the proportion of Lebanese and percentage of population with at least nursery school education in the United States with a correlation coefficient (R) of 0.146 and weighted average of 98.2%, a difference of 0.62%.
Nursery School Correlation Summary
| Measurement | Armenian | Lebanese |
| Minimum | 93.3% | 92.8% |
| Maximum | 100.0% | 100.0% |
| Range | 6.7% | 7.2% |
| Mean | 97.9% | 98.6% |
| Median | 98.1% | 98.9% |
| Interquartile 25% (IQ1) | 96.9% | 98.1% |
| Interquartile 75% (IQ3) | 99.3% | 100.0% |
| Interquartile Range (IQR) | 2.4% | 1.9% |
| Standard Deviation (Sample) | 1.8% | 1.7% |
| Standard Deviation (Population) | 1.7% | 1.7% |
Similar Demographics by Nursery School
Demographics Similar to Armenians by Nursery School
In terms of nursery school, the demographic groups most similar to Armenians are Immigrants from South America (97.6%, a difference of 0.0%), Cuban (97.6%, a difference of 0.010%), Immigrants from Ethiopia (97.6%, a difference of 0.010%), Jamaican (97.6%, a difference of 0.020%), and Fijian (97.6%, a difference of 0.020%).
| Demographics | Rating | Rank | Nursery School |
| Immigrants | Africa | 0.8 /100 | #252 | Tragic 97.6% |
| Immigrants | Iraq | 0.7 /100 | #253 | Tragic 97.6% |
| Immigrants | Congo | 0.7 /100 | #254 | Tragic 97.6% |
| Immigrants | Asia | 0.7 /100 | #255 | Tragic 97.6% |
| Yaqui | 0.6 /100 | #256 | Tragic 97.6% |
| Immigrants | Colombia | 0.6 /100 | #257 | Tragic 97.6% |
| Jamaicans | 0.6 /100 | #258 | Tragic 97.6% |
| Armenians | 0.4 /100 | #259 | Tragic 97.6% |
| Immigrants | South America | 0.4 /100 | #260 | Tragic 97.6% |
| Cubans | 0.4 /100 | #261 | Tragic 97.6% |
| Immigrants | Ethiopia | 0.4 /100 | #262 | Tragic 97.6% |
| Fijians | 0.3 /100 | #263 | Tragic 97.6% |
| Taiwanese | 0.3 /100 | #264 | Tragic 97.6% |
| Assyrians/Chaldeans/Syriacs | 0.3 /100 | #265 | Tragic 97.6% |
| Immigrants | Sierra Leone | 0.3 /100 | #266 | Tragic 97.6% |
Demographics Similar to Lebanese by Nursery School
In terms of nursery school, the demographic groups most similar to Lebanese are Immigrants from Japan (98.2%, a difference of 0.0%), Syrian (98.2%, a difference of 0.0%), Iroquois (98.2%, a difference of 0.0%), Menominee (98.2%, a difference of 0.0%), and Immigrants from Saudi Arabia (98.2%, a difference of 0.0%).
| Demographics | Rating | Rank | Nursery School |
| Immigrants | France | 95.6 /100 | #117 | Exceptional 98.2% |
| Yugoslavians | 95.4 /100 | #118 | Exceptional 98.2% |
| Thais | 95.0 /100 | #119 | Exceptional 98.2% |
| Okinawans | 94.5 /100 | #120 | Exceptional 98.2% |
| Immigrants | Zimbabwe | 94.2 /100 | #121 | Exceptional 98.2% |
| Immigrants | Japan | 94.0 /100 | #122 | Exceptional 98.2% |
| Syrians | 93.9 /100 | #123 | Exceptional 98.2% |
| Lebanese | 93.8 /100 | #124 | Exceptional 98.2% |
| Iroquois | 93.7 /100 | #125 | Exceptional 98.2% |
| Menominee | 93.6 /100 | #126 | Exceptional 98.2% |
| Immigrants | Saudi Arabia | 93.4 /100 | #127 | Exceptional 98.2% |
| Immigrants | Serbia | 92.4 /100 | #128 | Exceptional 98.2% |
| Cambodians | 91.4 /100 | #129 | Exceptional 98.2% |
| Immigrants | Croatia | 91.4 /100 | #130 | Exceptional 98.2% |
| Spaniards | 91.1 /100 | #131 | Exceptional 98.2% |