Armenian vs Immigrants from South America Bachelor's Degree

COMPARE

Armenian
Race
Ancestry
AfghanAfricanAlaska NativeAlaskan AthabascanAlbanianAleutAlsatianAmericanApacheArabArapahoArgentineanArmenianAssyrian/Chaldean/SyriacAustralianAustrianBahamianBangladeshiBarbadianBasqueBelgianBelizeanBermudanBhutaneseBlackfeetBolivianBrazilianBritishBritish West IndianBulgarianBurmeseCajunCambodianCanadianCape VerdeanCarpatho RusynCelticCentral AmericanCentral American IndianCherokeeCheyenneChickasawChileanChineseChippewaChoctawColombianColvilleComancheCosta RicanCreeCreekCroatianCrowCubanCypriotCzechCzechoslovakianDanishDelawareDominicanDutchDutch West IndianEastern EuropeanEcuadorianEgyptianEnglishEstonianEthiopianEuropeanFijianFilipinoFinnishFrenchFrench American IndianFrench CanadianGermanGerman RussianGhanaianGreekGuamanian/ChamorroGuatemalanGuyaneseHaitianHmongHonduranHopiHoumaHungarianIcelanderIndian (Asian)IndonesianInupiatIranianIraqiIrishIroquoisIsraeliItalianJamaicanJapaneseJordanianKenyanKiowaKoreanLaotianLatvianLebaneseLiberianLithuanianLumbeeLuxembourgerMacedonianMalaysianMalteseMarshalleseMenomineeMexicanMexican American IndianMongolianMoroccanNative HawaiianNavajoNepaleseNew ZealanderNicaraguanNigerianNorthern EuropeanNorwegianOkinawanOsageOttawaPaiutePakistaniPalestinianPanamanianParaguayanPennsylvania GermanPeruvianPimaPolishPortuguesePotawatomiPuebloPuerto RicanPuget Sound SalishRomanianRussianSalvadoranSamoanScandinavianScotch-IrishScottishSeminoleSenegaleseSerbianShoshoneSierra LeoneanSiouxSlavicSlovakSloveneSomaliSouth AfricanSouth AmericanSouth American IndianSoviet UnionSpaniardSpanishSpanish AmericanSpanish American IndianSri LankanSubsaharan AfricanSudaneseSwedishSwissSyrianTaiwaneseThaiTlingit-HaidaTohono O'OdhamTonganTrinidadian and TobagonianTsimshianTurkishU.S. Virgin IslanderUgandanUkrainianUruguayanUteVenezuelanVietnameseWelshWest IndianYakamaYaquiYugoslavianYumanYup'ikZimbabwean
Immigration
NonimmigrantsImmigrantsAfghanistanAfricaAlbaniaArgentinaArmeniaAsiaAustraliaAustriaBahamasBangladeshBarbadosBelarusBelgiumBelizeBoliviaBosnia and HerzegovinaBrazilBulgariaBurma/MyanmarCabo VerdeCambodiaCameroonCanadaCaribbeanCentral AmericaChileChinaColombiaCongoCosta RicaCroatiaCubaCzechoslovakiaDenmarkDominicaDominican RepublicEastern AfricaEastern AsiaEastern EuropeEcuadorEgyptEl SalvadorEnglandEritreaEthiopiaEuropeFijiFranceGermanyGhanaGreeceGrenadaGuatemalaGuyanaHaitiHondurasHong KongHungaryIndiaIndonesiaIranIraqIrelandIsraelItalyJamaicaJapanJordanKazakhstanKenyaKoreaKuwaitLaosLatin AmericaLatviaLebanonLiberiaLithuaniaMalaysiaMexicoMicronesiaMiddle AfricaMoldovaMoroccoNepalNetherlandsNicaraguaNigeriaNorth AmericaNorth MacedoniaNorthern AfricaNorthern EuropeNorwayOceaniaPakistanPanamaPeruPhilippinesPolandPortugalRomaniaRussiaSaudi ArabiaScotlandSenegalSerbiaSierra LeoneSingaporeSomaliaSouth AfricaSouth Central AsiaSouth Eastern AsiaSouthern EuropeSpainSri LankaSt. Vincent and the GrenadinesSudanSwedenSwitzerlandSyriaTaiwanThailandTrinidad and TobagoTurkeyUgandaUkraineUruguayUzbekistanVenezuelaVietnamWest IndiesWestern AfricaWestern AsiaWestern EuropeYemenZaireZimbabweAzores
Immigrants from South America
Race
Ancestry
AfghanAfricanAlaska NativeAlaskan AthabascanAlbanianAleutAlsatianAmericanApacheArabArapahoArgentineanAssyrian/Chaldean/SyriacAustralianAustrianBahamianBangladeshiBarbadianBasqueBelgianBelizeanBermudanBhutaneseBlackfeetBolivianBrazilianBritishBritish West IndianBulgarianBurmeseCajunCambodianCanadianCape VerdeanCarpatho RusynCelticCentral AmericanCentral American IndianCherokeeCheyenneChickasawChileanChineseChippewaChoctawColombianColvilleComancheCosta RicanCreeCreekCroatianCrowCubanCypriotCzechCzechoslovakianDanishDelawareDominicanDutchDutch West IndianEastern EuropeanEcuadorianEgyptianEnglishEstonianEthiopianEuropeanFijianFilipinoFinnishFrenchFrench American IndianFrench CanadianGermanGerman RussianGhanaianGreekGuamanian/ChamorroGuatemalanGuyaneseHaitianHmongHonduranHopiHoumaHungarianIcelanderIndian (Asian)IndonesianInupiatIranianIraqiIrishIroquoisIsraeliItalianJamaicanJapaneseJordanianKenyanKiowaKoreanLaotianLatvianLebaneseLiberianLithuanianLumbeeLuxembourgerMacedonianMalaysianMalteseMarshalleseMenomineeMexicanMexican American IndianMongolianMoroccanNative HawaiianNavajoNepaleseNew ZealanderNicaraguanNigerianNorthern EuropeanNorwegianOkinawanOsageOttawaPaiutePakistaniPalestinianPanamanianParaguayanPennsylvania GermanPeruvianPimaPolishPortuguesePotawatomiPuebloPuerto RicanPuget Sound SalishRomanianRussianSalvadoranSamoanScandinavianScotch-IrishScottishSeminoleSenegaleseSerbianShoshoneSierra LeoneanSiouxSlavicSlovakSloveneSomaliSouth AfricanSouth AmericanSouth American IndianSoviet UnionSpaniardSpanishSpanish AmericanSpanish American IndianSri LankanSubsaharan AfricanSudaneseSwedishSwissSyrianTaiwaneseThaiTlingit-HaidaTohono O'OdhamTonganTrinidadian and TobagonianTsimshianTurkishU.S. Virgin IslanderUgandanUkrainianUruguayanUteVenezuelanVietnameseWelshWest IndianYakamaYaquiYugoslavianYumanYup'ikZimbabwean
Immigration
NonimmigrantsImmigrantsAfghanistanAfricaAlbaniaArgentinaArmeniaAsiaAustraliaAustriaBahamasBangladeshBarbadosBelarusBelgiumBelizeBoliviaBosnia and HerzegovinaBrazilBulgariaBurma/MyanmarCabo VerdeCambodiaCameroonCanadaCaribbeanCentral AmericaChileChinaColombiaCongoCosta RicaCroatiaCubaCzechoslovakiaDenmarkDominicaDominican RepublicEastern AfricaEastern AsiaEastern EuropeEcuadorEgyptEl SalvadorEnglandEritreaEthiopiaEuropeFijiFranceGermanyGhanaGreeceGrenadaGuatemalaGuyanaHaitiHondurasHong KongHungaryIndiaIndonesiaIranIraqIrelandIsraelItalyJamaicaJapanJordanKazakhstanKenyaKoreaKuwaitLaosLatin AmericaLatviaLebanonLiberiaLithuaniaMalaysiaMexicoMicronesiaMiddle AfricaMoldovaMoroccoNepalNetherlandsNicaraguaNigeriaNorth AmericaNorth MacedoniaNorthern AfricaNorthern EuropeNorwayOceaniaPakistanPanamaPeruPhilippinesPolandPortugalRomaniaRussiaSaudi ArabiaScotlandSenegalSerbiaSierra LeoneSingaporeSomaliaSouth AfricaSouth AmericaSouth Central AsiaSouth Eastern AsiaSouthern EuropeSpainSri LankaSt. Vincent and the GrenadinesSudanSwedenSwitzerlandSyriaTaiwanThailandTrinidad and TobagoTurkeyUgandaUkraineUruguayUzbekistanVenezuelaVietnamWest IndiesWestern AfricaWestern AsiaWestern EuropeYemenZaireZimbabweAzores
Bachelor's Degree
Income
Poverty
Unemployment
Labor Participation
Family Structure
Vehicle Availability
Education Level
Disability

Bachelor's Degree Comparison

Armenians

Immigrants from South America

Exceptional
Good
42.3%
BACHELOR'S DEGREE
99.2/ 100
METRIC RATING
83rd/ 347
METRIC RANK
38.6%
BACHELOR'S DEGREE
70.1/ 100
METRIC RATING
157th/ 347
METRIC RANK

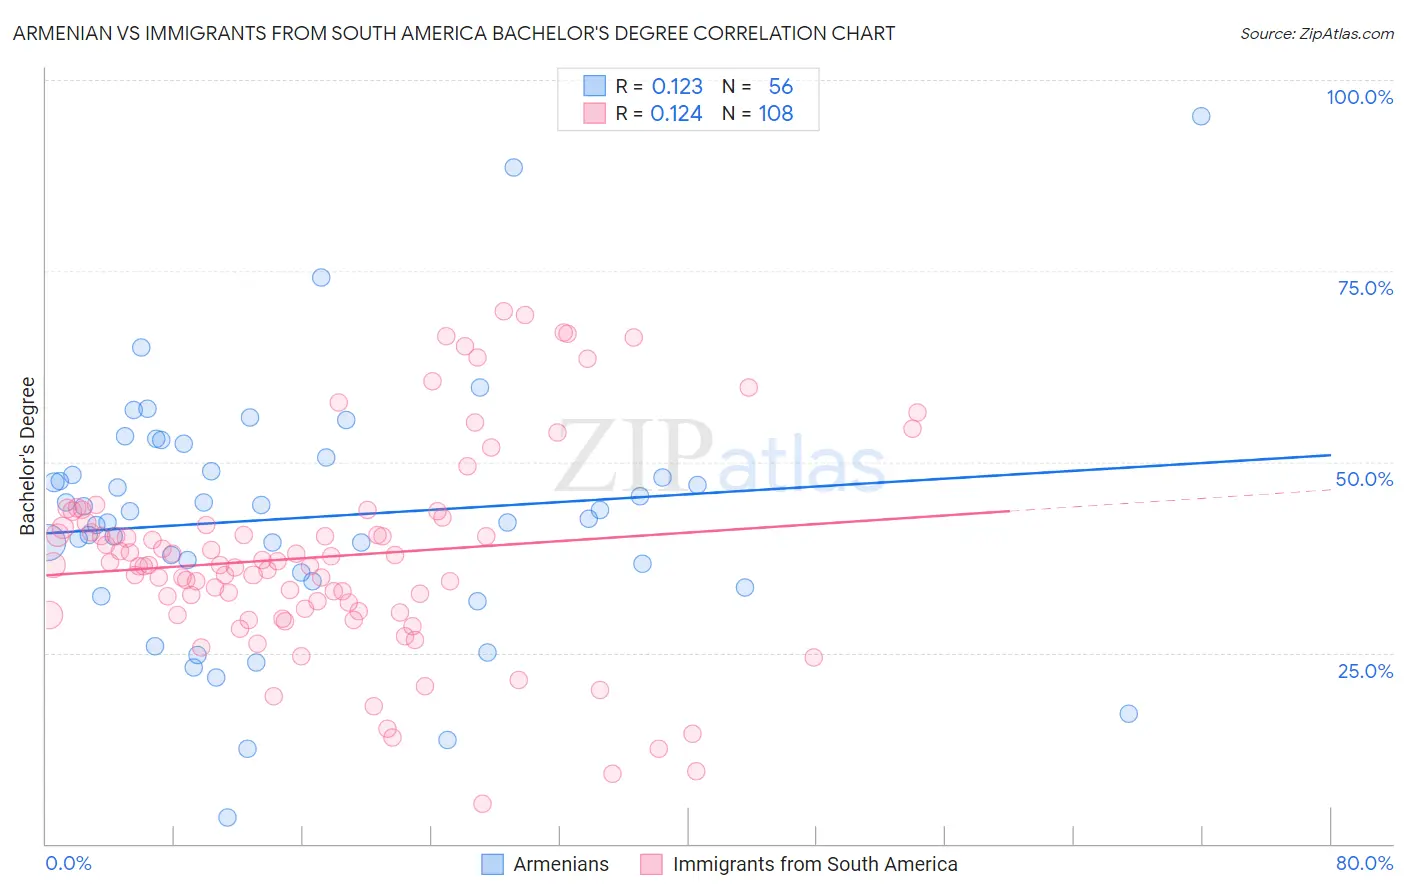
Armenian vs Immigrants from South America Bachelor's Degree Correlation Chart

The statistical analysis conducted on geographies consisting of 310,935,621 people shows a poor positive correlation between the proportion of Armenians and percentage of population with at least bachelor's degree education in the United States with a correlation coefficient (R) of 0.123 and weighted average of 42.3%. Similarly, the statistical analysis conducted on geographies consisting of 486,368,890 people shows a poor positive correlation between the proportion of Immigrants from South America and percentage of population with at least bachelor's degree education in the United States with a correlation coefficient (R) of 0.124 and weighted average of 38.6%, a difference of 9.5%.
Armenian vs Immigrants from South America Bachelor's Degree

Bachelor's Degree Correlation Summary

MeasurementArmenianImmigrants from South America
Minimum3.4%5.3%
Maximum95.3%69.7%
Range91.9%64.4%
Mean42.7%37.6%
Median43.0%36.4%
Interquartile 25% (IQ1)35.0%30.4%
Interquartile 75% (IQ3)49.7%41.9%
Interquartile Range (IQR)14.8%11.5%
Standard Deviation (Sample)16.3%13.4%
Standard Deviation (Population)16.2%13.4%

Similar Demographics by Bachelor's Degree

Demographics Similar to Armenians by Bachelor's Degree

In terms of bachelor's degree, the demographic groups most similar to Armenians are Immigrants from Western Asia (42.3%, a difference of 0.020%), Immigrants from Scotland (42.3%, a difference of 0.030%), Lithuanian (42.2%, a difference of 0.040%), Immigrants from Hungary (42.3%, a difference of 0.10%), and Immigrants from Croatia (42.3%, a difference of 0.11%).
DemographicsRating | RankBachelor's Degree
Immigrants | Egypt
99.4
/100
|
#76
Exceptional
42.6%
Immigrants | Eastern Europe
99.4
/100
|
#77
Exceptional
42.5%
Immigrants | Ethiopia
99.4
/100
|
#78
Exceptional
42.5%
Immigrants | Lebanon
99.3
/100
|
#79
Exceptional
42.4%
Immigrants | Croatia
99.2
/100
|
#80
Exceptional
42.3%
Immigrants | Hungary
99.2
/100
|
#81
Exceptional
42.3%
Immigrants | Scotland
99.2
/100
|
#82
Exceptional
42.3%
Armenians
99.2
/100
|
#83
Exceptional
42.3%
Immigrants | Western Asia
99.2
/100
|
#84
Exceptional
42.3%
Lithuanians
99.2
/100
|
#85
Exceptional
42.2%
Immigrants | Brazil
99.2
/100
|
#86
Exceptional
42.2%
Carpatho Rusyns
99.0
/100
|
#87
Exceptional
42.1%
Immigrants | Western Europe
99.0
/100
|
#88
Exceptional
42.0%
Greeks
99.0
/100
|
#89
Exceptional
42.0%
Laotians
98.9
/100
|
#90
Exceptional
42.0%

Demographics Similar to Immigrants from South America by Bachelor's Degree

In terms of bachelor's degree, the demographic groups most similar to Immigrants from South America are Immigrants from Germany (38.6%, a difference of 0.060%), Kenyan (38.7%, a difference of 0.28%), Chinese (38.5%, a difference of 0.39%), Vietnamese (38.5%, a difference of 0.39%), and Immigrants from Kenya (38.8%, a difference of 0.43%).
DemographicsRating | RankBachelor's Degree
South Americans
77.3
/100
|
#150
Good
38.9%
Immigrants | Africa
76.5
/100
|
#151
Good
38.9%
Sudanese
76.4
/100
|
#152
Good
38.9%
Slavs
75.9
/100
|
#153
Good
38.9%
Canadians
75.0
/100
|
#154
Good
38.8%
Immigrants | Kenya
73.8
/100
|
#155
Good
38.8%
Kenyans
72.5
/100
|
#156
Good
38.7%
Immigrants | South America
70.1
/100
|
#157
Good
38.6%
Immigrants | Germany
69.6
/100
|
#158
Good
38.6%
Chinese
66.6
/100
|
#159
Good
38.5%
Vietnamese
66.6
/100
|
#160
Good
38.5%
Uruguayans
65.8
/100
|
#161
Good
38.4%
Colombians
65.0
/100
|
#162
Good
38.4%
Peruvians
63.4
/100
|
#163
Good
38.3%
Hungarians
62.1
/100
|
#164
Good
38.3%