Arapaho vs Somali Professional Degree
COMPARE
Arapaho
Somali
Professional Degree
Professional Degree Comparison
Arapaho
Somalis
2.9%
PROFESSIONAL DEGREE
0.0/ 100
METRIC RATING
337th/ 347
METRIC RANK
4.1%
PROFESSIONAL DEGREE
14.8/ 100
METRIC RATING
205th/ 347
METRIC RANK
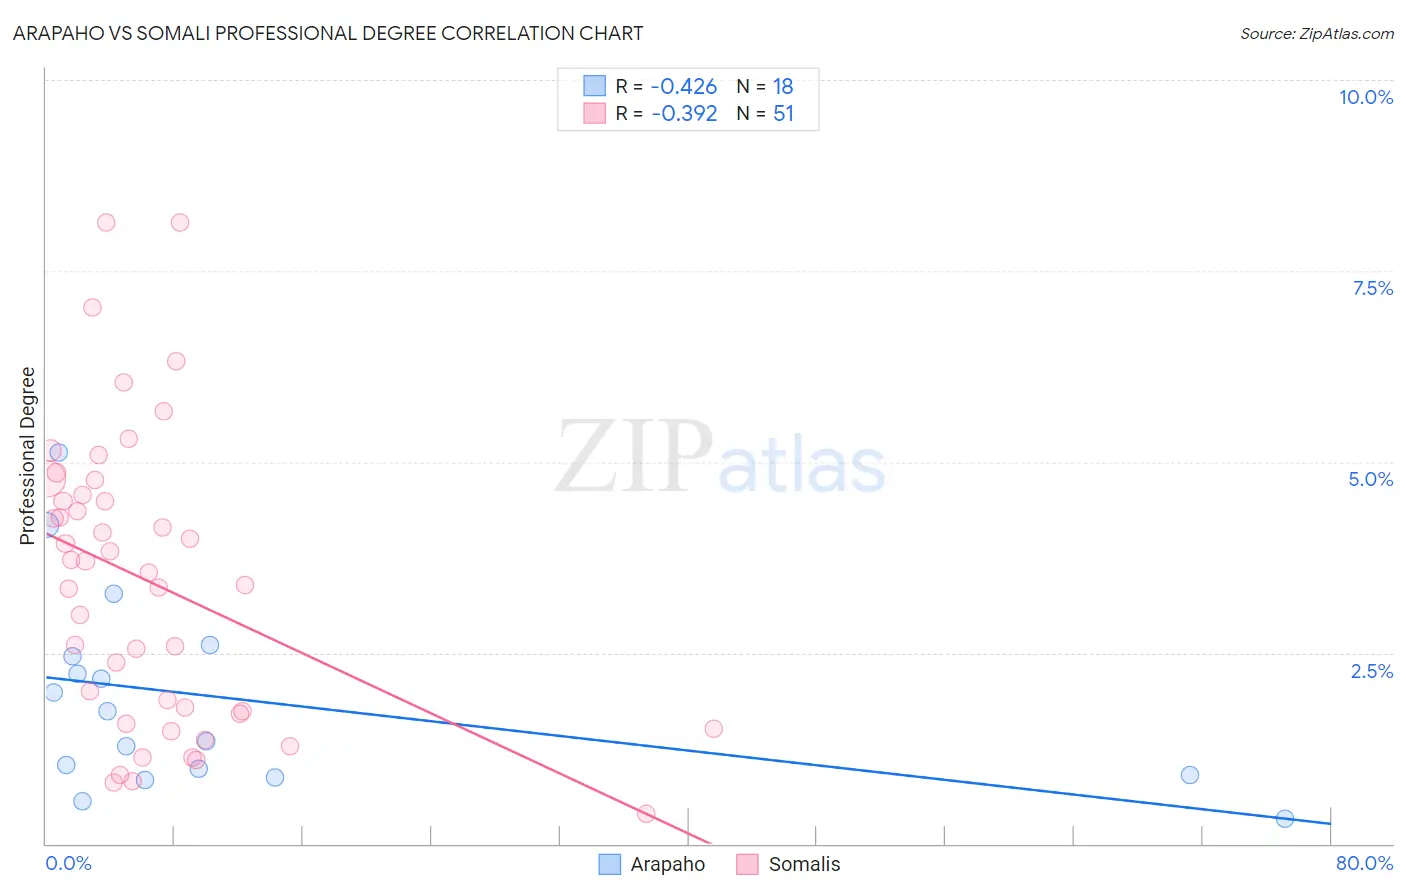
Arapaho vs Somali Professional Degree Correlation Chart
The statistical analysis conducted on geographies consisting of 29,727,239 people shows a moderate negative correlation between the proportion of Arapaho and percentage of population with at least professional degree education in the United States with a correlation coefficient (R) of -0.426 and weighted average of 2.9%. Similarly, the statistical analysis conducted on geographies consisting of 99,274,303 people shows a mild negative correlation between the proportion of Somalis and percentage of population with at least professional degree education in the United States with a correlation coefficient (R) of -0.392 and weighted average of 4.1%, a difference of 43.5%.
Professional Degree Correlation Summary
| Measurement | Arapaho | Somali |
| Minimum | 0.33% | 0.40% |
| Maximum | 5.1% | 8.1% |
| Range | 4.8% | 7.7% |
| Mean | 1.9% | 3.4% |
| Median | 1.5% | 3.5% |
| Interquartile 25% (IQ1) | 0.91% | 1.7% |
| Interquartile 75% (IQ3) | 2.4% | 4.6% |
| Interquartile Range (IQR) | 1.5% | 2.9% |
| Standard Deviation (Sample) | 1.3% | 1.9% |
| Standard Deviation (Population) | 1.3% | 1.9% |
Similar Demographics by Professional Degree
Demographics Similar to Arapaho by Professional Degree
In terms of professional degree, the demographic groups most similar to Arapaho are Navajo (2.9%, a difference of 0.070%), Immigrants from Central America (2.9%, a difference of 0.19%), Yup'ik (2.9%, a difference of 0.24%), Tohono O'odham (2.8%, a difference of 1.0%), and Immigrants from the Azores (2.8%, a difference of 1.7%).
| Demographics | Rating | Rank | Professional Degree |
| Immigrants | Cabo Verde | 0.0 /100 | #330 | Tragic 3.1% |
| Kiowa | 0.0 /100 | #331 | Tragic 3.1% |
| Yakama | 0.0 /100 | #332 | Tragic 3.1% |
| Puget Sound Salish | 0.0 /100 | #333 | Tragic 3.1% |
| Pennsylvania Germans | 0.0 /100 | #334 | Tragic 3.0% |
| Natives/Alaskans | 0.0 /100 | #335 | Tragic 3.0% |
| Fijians | 0.0 /100 | #336 | Tragic 2.9% |
| Arapaho | 0.0 /100 | #337 | Tragic 2.9% |
| Navajo | 0.0 /100 | #338 | Tragic 2.9% |
| Immigrants | Central America | 0.0 /100 | #339 | Tragic 2.9% |
| Yup'ik | 0.0 /100 | #340 | Tragic 2.9% |
| Tohono O'odham | 0.0 /100 | #341 | Tragic 2.8% |
| Immigrants | Azores | 0.0 /100 | #342 | Tragic 2.8% |
| Mexicans | 0.0 /100 | #343 | Tragic 2.7% |
| Spanish American Indians | 0.0 /100 | #344 | Tragic 2.7% |
Demographics Similar to Somalis by Professional Degree
In terms of professional degree, the demographic groups most similar to Somalis are Barbadian (4.1%, a difference of 0.32%), Panamanian (4.1%, a difference of 0.35%), Yugoslavian (4.1%, a difference of 0.42%), Subsaharan African (4.1%, a difference of 0.66%), and Immigrants from Iraq (4.2%, a difference of 0.68%).
| Demographics | Rating | Rank | Professional Degree |
| Immigrants | Middle Africa | 22.1 /100 | #198 | Fair 4.2% |
| Norwegians | 20.5 /100 | #199 | Fair 4.2% |
| Immigrants | North Macedonia | 20.2 /100 | #200 | Fair 4.2% |
| Finns | 18.7 /100 | #201 | Poor 4.2% |
| Immigrants | Iraq | 17.1 /100 | #202 | Poor 4.2% |
| Panamanians | 15.9 /100 | #203 | Poor 4.1% |
| Barbadians | 15.8 /100 | #204 | Poor 4.1% |
| Somalis | 14.8 /100 | #205 | Poor 4.1% |
| Yugoslavians | 13.4 /100 | #206 | Poor 4.1% |
| Sub-Saharan Africans | 12.8 /100 | #207 | Poor 4.1% |
| Immigrants | Somalia | 12.5 /100 | #208 | Poor 4.1% |
| Immigrants | Panama | 12.3 /100 | #209 | Poor 4.1% |
| Immigrants | Nigeria | 11.7 /100 | #210 | Poor 4.1% |
| Germans | 11.6 /100 | #211 | Poor 4.1% |
| Whites/Caucasians | 11.2 /100 | #212 | Poor 4.1% |