Arab vs Pennsylvania German Master's Degree

COMPARE

Arab
Race
Ancestry
AfghanAfricanAlaska NativeAlaskan AthabascanAlbanianAleutAlsatianAmericanApacheArabArapahoArgentineanArmenianAssyrian/Chaldean/SyriacAustralianAustrianBahamianBangladeshiBarbadianBasqueBelgianBelizeanBermudanBhutaneseBlackfeetBolivianBrazilianBritishBritish West IndianBulgarianBurmeseCajunCambodianCanadianCape VerdeanCarpatho RusynCelticCentral AmericanCentral American IndianCherokeeCheyenneChickasawChileanChineseChippewaChoctawColombianColvilleComancheCosta RicanCreeCreekCroatianCrowCubanCypriotCzechCzechoslovakianDanishDelawareDominicanDutchDutch West IndianEastern EuropeanEcuadorianEgyptianEnglishEstonianEthiopianEuropeanFijianFilipinoFinnishFrenchFrench American IndianFrench CanadianGermanGerman RussianGhanaianGreekGuamanian/ChamorroGuatemalanGuyaneseHaitianHmongHonduranHopiHoumaHungarianIcelanderIndian (Asian)IndonesianInupiatIranianIraqiIrishIroquoisIsraeliItalianJamaicanJapaneseJordanianKenyanKiowaKoreanLaotianLatvianLebaneseLiberianLithuanianLumbeeLuxembourgerMacedonianMalaysianMalteseMarshalleseMenomineeMexicanMexican American IndianMongolianMoroccanNative HawaiianNavajoNepaleseNew ZealanderNicaraguanNigerianNorthern EuropeanNorwegianOkinawanOsageOttawaPaiutePakistaniPalestinianPanamanianParaguayanPeruvianPimaPolishPortuguesePotawatomiPuebloPuerto RicanPuget Sound SalishRomanianRussianSalvadoranSamoanScandinavianScotch-IrishScottishSeminoleSenegaleseSerbianShoshoneSierra LeoneanSiouxSlavicSlovakSloveneSomaliSouth AfricanSouth AmericanSouth American IndianSoviet UnionSpaniardSpanishSpanish AmericanSpanish American IndianSri LankanSubsaharan AfricanSudaneseSwedishSwissSyrianTaiwaneseThaiTlingit-HaidaTohono O'OdhamTonganTrinidadian and TobagonianTsimshianTurkishU.S. Virgin IslanderUgandanUkrainianUruguayanUteVenezuelanVietnameseWelshWest IndianYakamaYaquiYugoslavianYumanYup'ikZimbabwean
Immigration
NonimmigrantsImmigrantsAfghanistanAfricaAlbaniaArgentinaArmeniaAsiaAustraliaAustriaBahamasBangladeshBarbadosBelarusBelgiumBelizeBoliviaBosnia and HerzegovinaBrazilBulgariaBurma/MyanmarCabo VerdeCambodiaCameroonCanadaCaribbeanCentral AmericaChileChinaColombiaCongoCosta RicaCroatiaCubaCzechoslovakiaDenmarkDominicaDominican RepublicEastern AfricaEastern AsiaEastern EuropeEcuadorEgyptEl SalvadorEnglandEritreaEthiopiaEuropeFijiFranceGermanyGhanaGreeceGrenadaGuatemalaGuyanaHaitiHondurasHong KongHungaryIndiaIndonesiaIranIraqIrelandIsraelItalyJamaicaJapanJordanKazakhstanKenyaKoreaKuwaitLaosLatin AmericaLatviaLebanonLiberiaLithuaniaMalaysiaMexicoMicronesiaMiddle AfricaMoldovaMoroccoNepalNetherlandsNicaraguaNigeriaNorth AmericaNorth MacedoniaNorthern AfricaNorthern EuropeNorwayOceaniaPakistanPanamaPeruPhilippinesPolandPortugalRomaniaRussiaSaudi ArabiaScotlandSenegalSerbiaSierra LeoneSingaporeSomaliaSouth AfricaSouth AmericaSouth Central AsiaSouth Eastern AsiaSouthern EuropeSpainSri LankaSt. Vincent and the GrenadinesSudanSwedenSwitzerlandSyriaTaiwanThailandTrinidad and TobagoTurkeyUgandaUkraineUruguayUzbekistanVenezuelaVietnamWest IndiesWestern AfricaWestern AsiaWestern EuropeYemenZaireZimbabweAzores
Pennsylvania German
Race
Ancestry
AfghanAfricanAlaska NativeAlaskan AthabascanAlbanianAleutAlsatianAmericanApacheArapahoArgentineanArmenianAssyrian/Chaldean/SyriacAustralianAustrianBahamianBangladeshiBarbadianBasqueBelgianBelizeanBermudanBhutaneseBlackfeetBolivianBrazilianBritishBritish West IndianBulgarianBurmeseCajunCambodianCanadianCape VerdeanCarpatho RusynCelticCentral AmericanCentral American IndianCherokeeCheyenneChickasawChileanChineseChippewaChoctawColombianColvilleComancheCosta RicanCreeCreekCroatianCrowCubanCypriotCzechCzechoslovakianDanishDelawareDominicanDutchDutch West IndianEastern EuropeanEcuadorianEgyptianEnglishEstonianEthiopianEuropeanFijianFilipinoFinnishFrenchFrench American IndianFrench CanadianGermanGerman RussianGhanaianGreekGuamanian/ChamorroGuatemalanGuyaneseHaitianHmongHonduranHopiHoumaHungarianIcelanderIndian (Asian)IndonesianInupiatIranianIraqiIrishIroquoisIsraeliItalianJamaicanJapaneseJordanianKenyanKiowaKoreanLaotianLatvianLebaneseLiberianLithuanianLumbeeLuxembourgerMacedonianMalaysianMalteseMarshalleseMenomineeMexicanMexican American IndianMongolianMoroccanNative HawaiianNavajoNepaleseNew ZealanderNicaraguanNigerianNorthern EuropeanNorwegianOkinawanOsageOttawaPaiutePakistaniPalestinianPanamanianParaguayanPennsylvania GermanPeruvianPimaPolishPortuguesePotawatomiPuebloPuerto RicanPuget Sound SalishRomanianRussianSalvadoranSamoanScandinavianScotch-IrishScottishSeminoleSenegaleseSerbianShoshoneSierra LeoneanSiouxSlavicSlovakSloveneSomaliSouth AfricanSouth AmericanSouth American IndianSoviet UnionSpaniardSpanishSpanish AmericanSpanish American IndianSri LankanSubsaharan AfricanSudaneseSwedishSwissSyrianTaiwaneseThaiTlingit-HaidaTohono O'OdhamTonganTrinidadian and TobagonianTsimshianTurkishU.S. Virgin IslanderUgandanUkrainianUruguayanUteVenezuelanVietnameseWelshWest IndianYakamaYaquiYugoslavianYumanYup'ikZimbabwean
Immigration
NonimmigrantsImmigrantsAfghanistanAfricaAlbaniaArgentinaArmeniaAsiaAustraliaAustriaBahamasBangladeshBarbadosBelarusBelgiumBelizeBoliviaBosnia and HerzegovinaBrazilBulgariaBurma/MyanmarCabo VerdeCambodiaCameroonCanadaCaribbeanCentral AmericaChileChinaColombiaCongoCosta RicaCroatiaCubaCzechoslovakiaDenmarkDominicaDominican RepublicEastern AfricaEastern AsiaEastern EuropeEcuadorEgyptEl SalvadorEnglandEritreaEthiopiaEuropeFijiFranceGermanyGhanaGreeceGrenadaGuatemalaGuyanaHaitiHondurasHong KongHungaryIndiaIndonesiaIranIraqIrelandIsraelItalyJamaicaJapanJordanKazakhstanKenyaKoreaKuwaitLaosLatin AmericaLatviaLebanonLiberiaLithuaniaMalaysiaMexicoMicronesiaMiddle AfricaMoldovaMoroccoNepalNetherlandsNicaraguaNigeriaNorth AmericaNorth MacedoniaNorthern AfricaNorthern EuropeNorwayOceaniaPakistanPanamaPeruPhilippinesPolandPortugalRomaniaRussiaSaudi ArabiaScotlandSenegalSerbiaSierra LeoneSingaporeSomaliaSouth AfricaSouth AmericaSouth Central AsiaSouth Eastern AsiaSouthern EuropeSpainSri LankaSt. Vincent and the GrenadinesSudanSwedenSwitzerlandSyriaTaiwanThailandTrinidad and TobagoTurkeyUgandaUkraineUruguayUzbekistanVenezuelaVietnamWest IndiesWestern AfricaWestern AsiaWestern EuropeYemenZaireZimbabweAzores
Master's Degree
Income
Poverty
Unemployment
Labor Participation
Family Structure
Vehicle Availability
Education Level
Disability

Master's Degree Comparison

Arabs

Pennsylvania Germans

Exceptional
Tragic
16.7%
MASTER'S DEGREE
97.7/ 100
METRIC RATING
113th/ 347
METRIC RANK
10.7%
MASTER'S DEGREE
0.0/ 100
METRIC RATING
321st/ 347
METRIC RANK

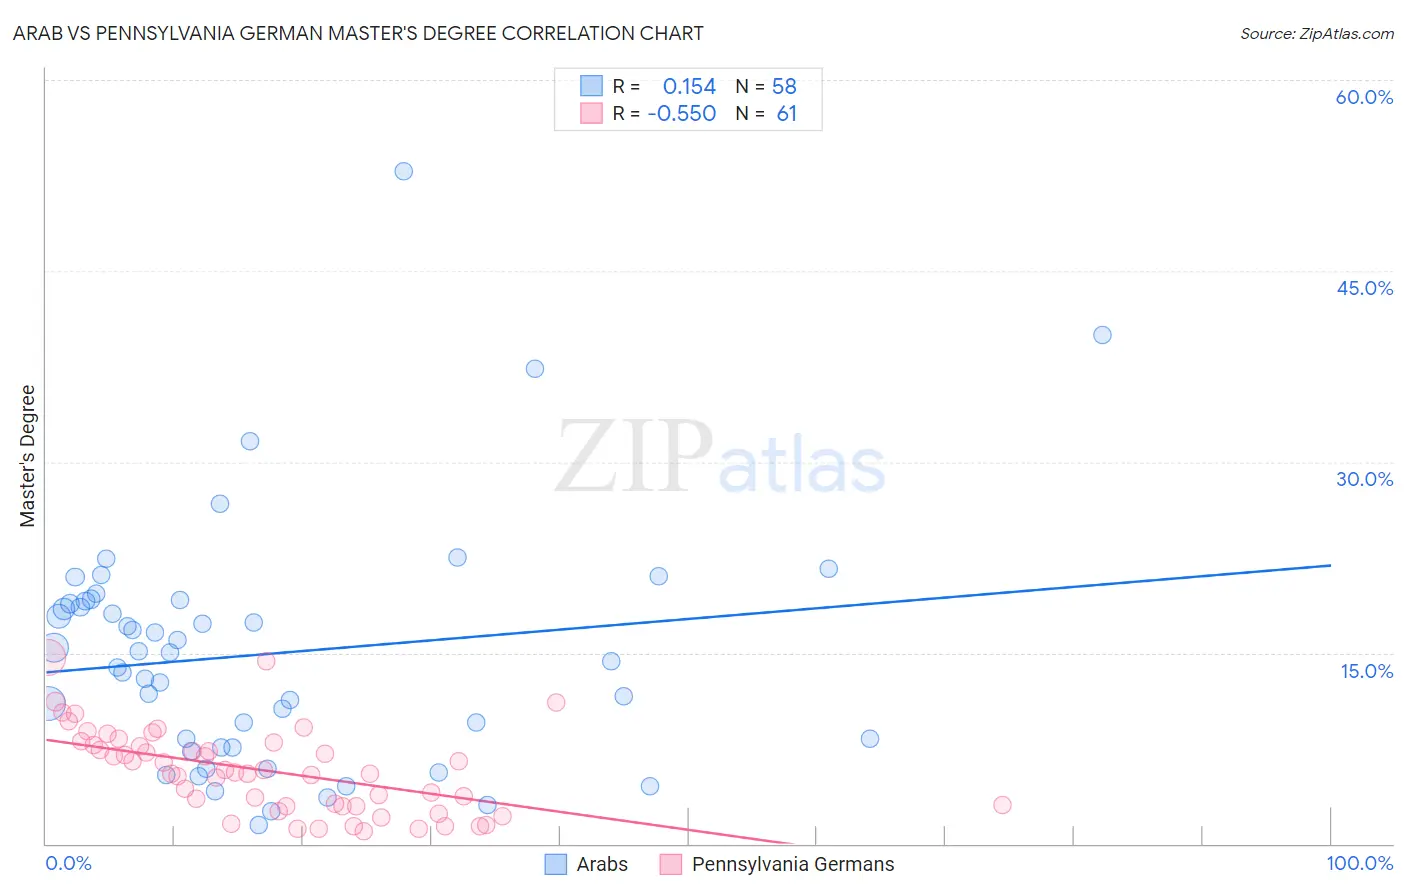
Arab vs Pennsylvania German Master's Degree Correlation Chart

The statistical analysis conducted on geographies consisting of 486,607,303 people shows a poor positive correlation between the proportion of Arabs and percentage of population with at least master's degree education in the United States with a correlation coefficient (R) of 0.154 and weighted average of 16.7%. Similarly, the statistical analysis conducted on geographies consisting of 234,030,574 people shows a substantial negative correlation between the proportion of Pennsylvania Germans and percentage of population with at least master's degree education in the United States with a correlation coefficient (R) of -0.550 and weighted average of 10.7%, a difference of 55.5%.
Arab vs Pennsylvania German Master's Degree

Master's Degree Correlation Summary

MeasurementArabPennsylvania German
Minimum1.5%1.0%
Maximum52.8%14.6%
Range51.4%13.6%
Mean14.9%5.7%
Median14.7%5.6%
Interquartile 25% (IQ1)7.6%3.0%
Interquartile 75% (IQ3)19.1%7.9%
Interquartile Range (IQR)11.5%4.9%
Standard Deviation (Sample)9.5%3.3%
Standard Deviation (Population)9.5%3.2%

Similar Demographics by Master's Degree

Demographics Similar to Arabs by Master's Degree

In terms of master's degree, the demographic groups most similar to Arabs are Macedonian (16.7%, a difference of 0.010%), Northern European (16.7%, a difference of 0.070%), Austrian (16.7%, a difference of 0.15%), Immigrants from Uganda (16.6%, a difference of 0.37%), and Immigrants from Chile (16.8%, a difference of 0.42%).
DemographicsRating | RankMaster's Degree
Immigrants | Albania
98.1
/100
|
#106
Exceptional
16.8%
Armenians
98.0
/100
|
#107
Exceptional
16.8%
Sierra Leoneans
98.0
/100
|
#108
Exceptional
16.8%
Moroccans
98.0
/100
|
#109
Exceptional
16.8%
Immigrants | Chile
98.0
/100
|
#110
Exceptional
16.8%
Austrians
97.8
/100
|
#111
Exceptional
16.7%
Macedonians
97.7
/100
|
#112
Exceptional
16.7%
Arabs
97.7
/100
|
#113
Exceptional
16.7%
Northern Europeans
97.6
/100
|
#114
Exceptional
16.7%
Immigrants | Uganda
97.3
/100
|
#115
Exceptional
16.6%
Immigrants | Southern Europe
97.2
/100
|
#116
Exceptional
16.6%
Immigrants | Moldova
97.2
/100
|
#117
Exceptional
16.6%
Brazilians
96.8
/100
|
#118
Exceptional
16.5%
Jordanians
96.5
/100
|
#119
Exceptional
16.5%
Lebanese
96.4
/100
|
#120
Exceptional
16.5%

Demographics Similar to Pennsylvania Germans by Master's Degree

In terms of master's degree, the demographic groups most similar to Pennsylvania Germans are Immigrants from Micronesia (10.8%, a difference of 0.21%), Sioux (10.7%, a difference of 0.64%), Kiowa (10.8%, a difference of 0.83%), Crow (10.6%, a difference of 1.0%), and Immigrants from Cuba (10.9%, a difference of 1.1%).
DemographicsRating | RankMaster's Degree
Cajuns
0.0
/100
|
#314
Tragic
11.0%
Apache
0.0
/100
|
#315
Tragic
11.0%
Hispanics or Latinos
0.0
/100
|
#316
Tragic
10.9%
Hopi
0.0
/100
|
#317
Tragic
10.9%
Immigrants | Cuba
0.0
/100
|
#318
Tragic
10.9%
Kiowa
0.0
/100
|
#319
Tragic
10.8%
Immigrants | Micronesia
0.0
/100
|
#320
Tragic
10.8%
Pennsylvania Germans
0.0
/100
|
#321
Tragic
10.7%
Sioux
0.0
/100
|
#322
Tragic
10.7%
Crow
0.0
/100
|
#323
Tragic
10.6%
Dutch West Indians
0.0
/100
|
#324
Tragic
10.6%
Inupiat
0.0
/100
|
#325
Tragic
10.5%
Creek
0.0
/100
|
#326
Tragic
10.5%
Paiute
0.0
/100
|
#327
Tragic
10.5%
Bangladeshis
0.0
/100
|
#328
Tragic
10.5%