Arab vs Immigrants from Lebanon Bachelor's Degree
COMPARE
Arab
Immigrants from Lebanon
Bachelor's Degree
Bachelor's Degree Comparison
Arabs
Immigrants from Lebanon
40.9%
BACHELOR'S DEGREE
96.6/ 100
METRIC RATING
109th/ 347
METRIC RANK
42.4%
BACHELOR'S DEGREE
99.3/ 100
METRIC RATING
79th/ 347
METRIC RANK
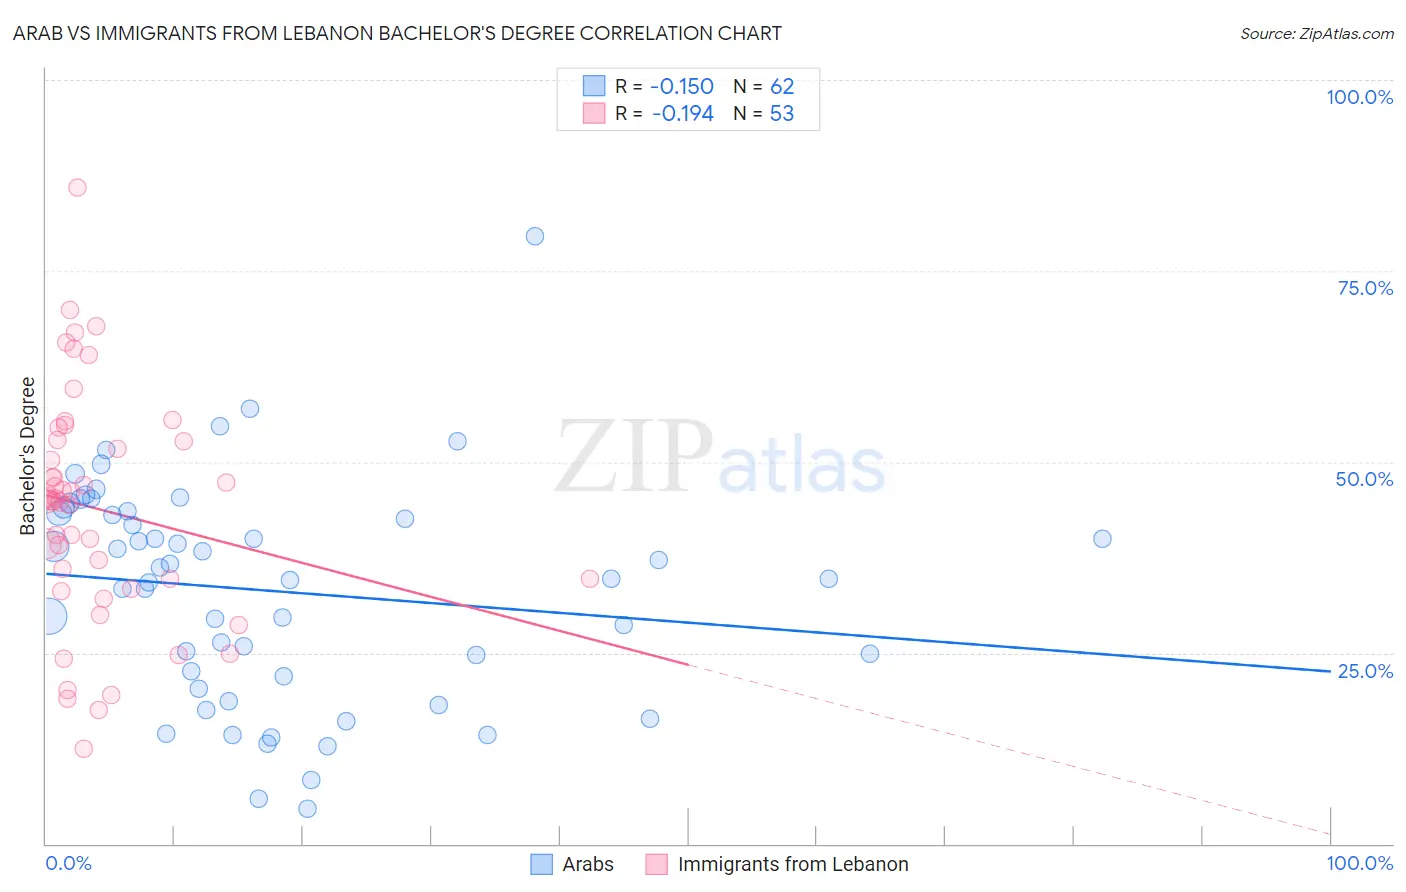
Arab vs Immigrants from Lebanon Bachelor's Degree Correlation Chart
The statistical analysis conducted on geographies consisting of 486,810,717 people shows a poor negative correlation between the proportion of Arabs and percentage of population with at least bachelor's degree education in the United States with a correlation coefficient (R) of -0.150 and weighted average of 40.9%. Similarly, the statistical analysis conducted on geographies consisting of 217,160,107 people shows a poor negative correlation between the proportion of Immigrants from Lebanon and percentage of population with at least bachelor's degree education in the United States with a correlation coefficient (R) of -0.194 and weighted average of 42.4%, a difference of 3.7%.
Bachelor's Degree Correlation Summary
| Measurement | Arab | Immigrants from Lebanon |
| Minimum | 4.6% | 12.4% |
| Maximum | 79.5% | 86.0% |
| Range | 74.9% | 73.5% |
| Mean | 33.1% | 43.8% |
| Median | 34.8% | 45.0% |
| Interquartile 25% (IQ1) | 21.9% | 34.0% |
| Interquartile 75% (IQ3) | 43.2% | 52.8% |
| Interquartile Range (IQR) | 21.4% | 18.8% |
| Standard Deviation (Sample) | 14.4% | 15.0% |
| Standard Deviation (Population) | 14.3% | 14.8% |
Similar Demographics by Bachelor's Degree
Demographics Similar to Arabs by Bachelor's Degree
In terms of bachelor's degree, the demographic groups most similar to Arabs are Ukrainian (40.9%, a difference of 0.020%), Albanian (40.9%, a difference of 0.080%), Immigrants from Chile (40.8%, a difference of 0.12%), Northern European (41.0%, a difference of 0.16%), and Ugandan (40.8%, a difference of 0.17%).
| Demographics | Rating | Rank | Bachelor's Degree |
| Immigrants | Italy | 97.8 /100 | #102 | Exceptional 41.3% |
| Chileans | 97.5 /100 | #103 | Exceptional 41.2% |
| Jordanians | 97.4 /100 | #104 | Exceptional 41.2% |
| Syrians | 97.4 /100 | #105 | Exceptional 41.1% |
| Alsatians | 97.0 /100 | #106 | Exceptional 41.0% |
| Northern Europeans | 96.8 /100 | #107 | Exceptional 41.0% |
| Ukrainians | 96.6 /100 | #108 | Exceptional 40.9% |
| Arabs | 96.6 /100 | #109 | Exceptional 40.9% |
| Albanians | 96.5 /100 | #110 | Exceptional 40.9% |
| Immigrants | Chile | 96.4 /100 | #111 | Exceptional 40.8% |
| Ugandans | 96.3 /100 | #112 | Exceptional 40.8% |
| Brazilians | 96.3 /100 | #113 | Exceptional 40.8% |
| Afghans | 96.2 /100 | #114 | Exceptional 40.8% |
| Palestinians | 95.8 /100 | #115 | Exceptional 40.7% |
| Immigrants | Uganda | 95.7 /100 | #116 | Exceptional 40.7% |
Demographics Similar to Immigrants from Lebanon by Bachelor's Degree
In terms of bachelor's degree, the demographic groups most similar to Immigrants from Lebanon are Immigrants from Ethiopia (42.5%, a difference of 0.17%), Immigrants from Croatia (42.3%, a difference of 0.20%), Immigrants from Hungary (42.3%, a difference of 0.21%), Immigrants from Eastern Europe (42.5%, a difference of 0.23%), and Immigrants from Scotland (42.3%, a difference of 0.28%).
| Demographics | Rating | Rank | Bachelor's Degree |
| Ethiopians | 99.5 /100 | #72 | Exceptional 42.8% |
| Immigrants | Uzbekistan | 99.5 /100 | #73 | Exceptional 42.8% |
| Bhutanese | 99.5 /100 | #74 | Exceptional 42.7% |
| Immigrants | Zimbabwe | 99.4 /100 | #75 | Exceptional 42.6% |
| Immigrants | Egypt | 99.4 /100 | #76 | Exceptional 42.6% |
| Immigrants | Eastern Europe | 99.4 /100 | #77 | Exceptional 42.5% |
| Immigrants | Ethiopia | 99.4 /100 | #78 | Exceptional 42.5% |
| Immigrants | Lebanon | 99.3 /100 | #79 | Exceptional 42.4% |
| Immigrants | Croatia | 99.2 /100 | #80 | Exceptional 42.3% |
| Immigrants | Hungary | 99.2 /100 | #81 | Exceptional 42.3% |
| Immigrants | Scotland | 99.2 /100 | #82 | Exceptional 42.3% |
| Armenians | 99.2 /100 | #83 | Exceptional 42.3% |
| Immigrants | Western Asia | 99.2 /100 | #84 | Exceptional 42.3% |
| Lithuanians | 99.2 /100 | #85 | Exceptional 42.2% |
| Immigrants | Brazil | 99.2 /100 | #86 | Exceptional 42.2% |