Apache vs Guatemalan Associate's Degree
COMPARE
Apache
Guatemalan
Associate's Degree
Associate's Degree Comparison
Apache
Guatemalans
36.2%
ASSOCIATE'S DEGREE
0.0/ 100
METRIC RATING
330th/ 347
METRIC RANK
38.5%
ASSOCIATE'S DEGREE
0.0/ 100
METRIC RATING
303rd/ 347
METRIC RANK
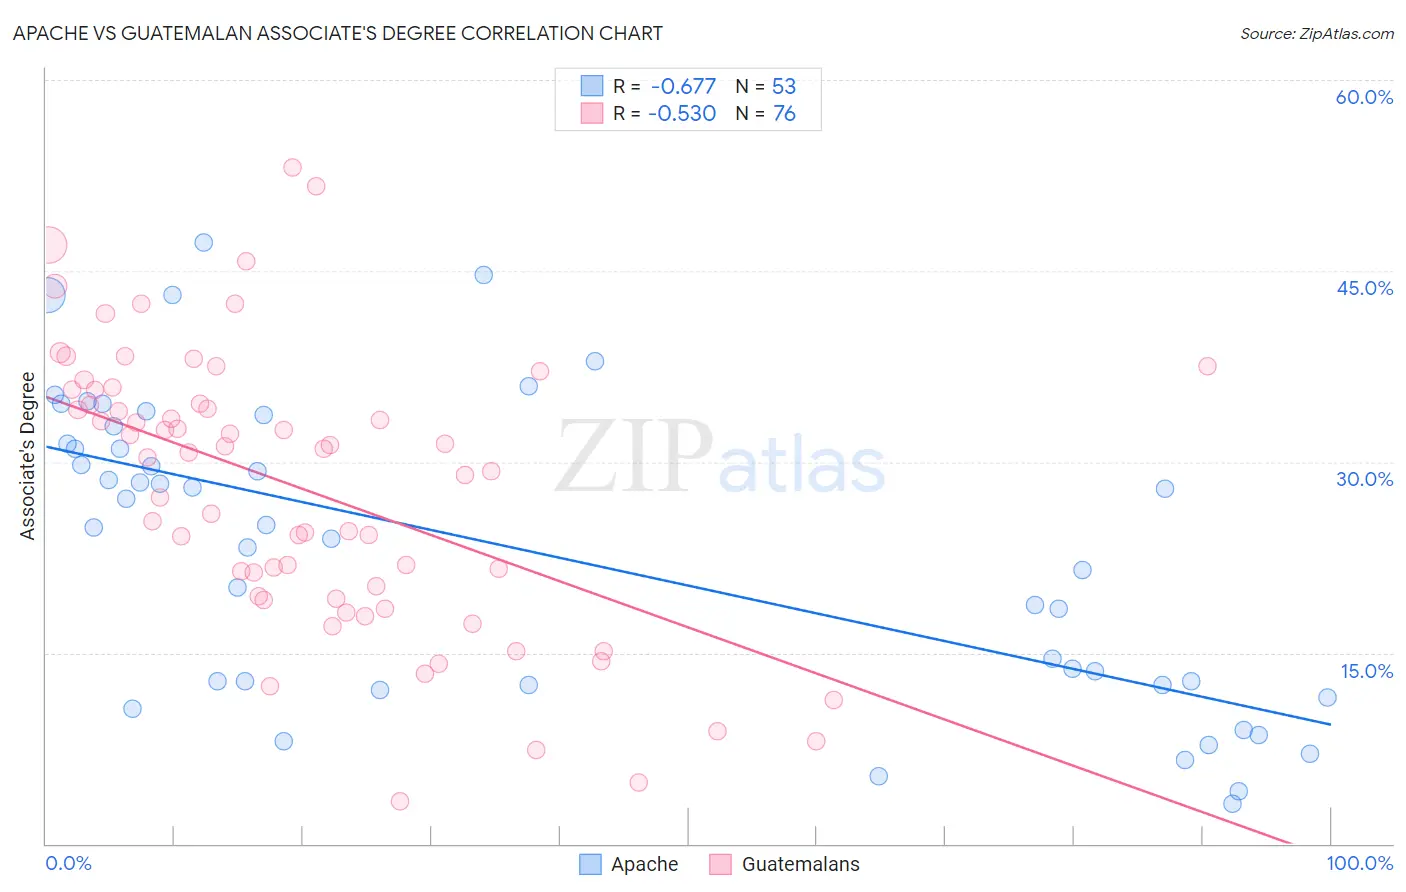
Apache vs Guatemalan Associate's Degree Correlation Chart
The statistical analysis conducted on geographies consisting of 231,140,415 people shows a significant negative correlation between the proportion of Apache and percentage of population with at least associate's degree education in the United States with a correlation coefficient (R) of -0.677 and weighted average of 36.2%. Similarly, the statistical analysis conducted on geographies consisting of 409,533,584 people shows a substantial negative correlation between the proportion of Guatemalans and percentage of population with at least associate's degree education in the United States with a correlation coefficient (R) of -0.530 and weighted average of 38.5%, a difference of 6.2%.
Associate's Degree Correlation Summary
| Measurement | Apache | Guatemalan |
| Minimum | 3.2% | 3.3% |
| Maximum | 47.2% | 53.1% |
| Range | 44.0% | 49.8% |
| Mean | 23.0% | 27.8% |
| Median | 24.9% | 30.6% |
| Interquartile 25% (IQ1) | 12.5% | 19.3% |
| Interquartile 75% (IQ3) | 32.1% | 35.1% |
| Interquartile Range (IQR) | 19.6% | 15.8% |
| Standard Deviation (Sample) | 11.9% | 11.0% |
| Standard Deviation (Population) | 11.7% | 10.9% |
Similar Demographics by Associate's Degree
Demographics Similar to Apache by Associate's Degree
In terms of associate's degree, the demographic groups most similar to Apache are Paiute (36.4%, a difference of 0.31%), Alaskan Athabascan (36.5%, a difference of 0.60%), Dutch West Indian (36.5%, a difference of 0.61%), Kiowa (36.5%, a difference of 0.63%), and Menominee (36.7%, a difference of 1.2%).
| Demographics | Rating | Rank | Associate's Degree |
| Immigrants | Cabo Verde | 0.0 /100 | #323 | Tragic 36.8% |
| Arapaho | 0.0 /100 | #324 | Tragic 36.7% |
| Menominee | 0.0 /100 | #325 | Tragic 36.7% |
| Kiowa | 0.0 /100 | #326 | Tragic 36.5% |
| Dutch West Indians | 0.0 /100 | #327 | Tragic 36.5% |
| Alaskan Athabascans | 0.0 /100 | #328 | Tragic 36.5% |
| Paiute | 0.0 /100 | #329 | Tragic 36.4% |
| Apache | 0.0 /100 | #330 | Tragic 36.2% |
| Immigrants | Azores | 0.0 /100 | #331 | Tragic 35.6% |
| Immigrants | Central America | 0.0 /100 | #332 | Tragic 35.0% |
| Mexicans | 0.0 /100 | #333 | Tragic 35.0% |
| Natives/Alaskans | 0.0 /100 | #334 | Tragic 34.9% |
| Spanish American Indians | 0.0 /100 | #335 | Tragic 34.9% |
| Hopi | 0.0 /100 | #336 | Tragic 34.6% |
| Lumbee | 0.0 /100 | #337 | Tragic 34.1% |
Demographics Similar to Guatemalans by Associate's Degree
In terms of associate's degree, the demographic groups most similar to Guatemalans are Sioux (38.5%, a difference of 0.050%), Colville (38.5%, a difference of 0.090%), Immigrants from Honduras (38.5%, a difference of 0.12%), Shoshone (38.4%, a difference of 0.19%), and Immigrants from El Salvador (38.4%, a difference of 0.23%).
| Demographics | Rating | Rank | Associate's Degree |
| Cherokee | 0.0 /100 | #296 | Tragic 38.9% |
| Cape Verdeans | 0.0 /100 | #297 | Tragic 38.8% |
| Cheyenne | 0.0 /100 | #298 | Tragic 38.7% |
| Ute | 0.0 /100 | #299 | Tragic 38.6% |
| Chickasaw | 0.0 /100 | #300 | Tragic 38.6% |
| Tsimshian | 0.0 /100 | #301 | Tragic 38.6% |
| Colville | 0.0 /100 | #302 | Tragic 38.5% |
| Guatemalans | 0.0 /100 | #303 | Tragic 38.5% |
| Sioux | 0.0 /100 | #304 | Tragic 38.5% |
| Immigrants | Honduras | 0.0 /100 | #305 | Tragic 38.5% |
| Shoshone | 0.0 /100 | #306 | Tragic 38.4% |
| Immigrants | El Salvador | 0.0 /100 | #307 | Tragic 38.4% |
| Mexican American Indians | 0.0 /100 | #308 | Tragic 38.2% |
| Immigrants | Guatemala | 0.0 /100 | #309 | Tragic 38.1% |
| Immigrants | Dominican Republic | 0.0 /100 | #310 | Tragic 37.9% |