American vs Immigrants from Kazakhstan Professional Degree

COMPARE

American
Race
Ancestry
AfghanAfricanAlaska NativeAlaskan AthabascanAlbanianAleutAlsatianAmericanApacheArabArapahoArgentineanArmenianAssyrian/Chaldean/SyriacAustralianAustrianBahamianBangladeshiBarbadianBasqueBelgianBelizeanBermudanBhutaneseBlackfeetBolivianBrazilianBritishBritish West IndianBulgarianBurmeseCajunCambodianCanadianCape VerdeanCarpatho RusynCelticCentral AmericanCentral American IndianCherokeeCheyenneChickasawChileanChineseChippewaChoctawColombianColvilleComancheCosta RicanCreeCreekCroatianCrowCubanCypriotCzechCzechoslovakianDanishDelawareDominicanDutchDutch West IndianEastern EuropeanEcuadorianEgyptianEnglishEstonianEthiopianEuropeanFijianFilipinoFinnishFrenchFrench American IndianFrench CanadianGermanGerman RussianGhanaianGreekGuamanian/ChamorroGuatemalanGuyaneseHaitianHmongHonduranHopiHoumaHungarianIcelanderIndian (Asian)IndonesianInupiatIranianIraqiIrishIroquoisIsraeliItalianJamaicanJapaneseJordanianKenyanKiowaKoreanLaotianLatvianLebaneseLiberianLithuanianLumbeeLuxembourgerMacedonianMalaysianMalteseMarshalleseMenomineeMexicanMexican American IndianMongolianMoroccanNative HawaiianNavajoNepaleseNew ZealanderNicaraguanNigerianNorthern EuropeanNorwegianOkinawanOsageOttawaPaiutePakistaniPalestinianPanamanianParaguayanPennsylvania GermanPeruvianPimaPolishPortuguesePotawatomiPuebloPuerto RicanPuget Sound SalishRomanianRussianSalvadoranSamoanScandinavianScotch-IrishScottishSeminoleSenegaleseSerbianShoshoneSierra LeoneanSiouxSlavicSlovakSloveneSomaliSouth AfricanSouth AmericanSouth American IndianSoviet UnionSpaniardSpanishSpanish AmericanSpanish American IndianSri LankanSubsaharan AfricanSudaneseSwedishSwissSyrianTaiwaneseThaiTlingit-HaidaTohono O'OdhamTonganTrinidadian and TobagonianTsimshianTurkishU.S. Virgin IslanderUgandanUkrainianUruguayanUteVenezuelanVietnameseWelshWest IndianYakamaYaquiYugoslavianYumanYup'ikZimbabwean
Immigration
NonimmigrantsImmigrantsAfghanistanAfricaAlbaniaArgentinaArmeniaAsiaAustraliaAustriaBahamasBangladeshBarbadosBelarusBelgiumBelizeBoliviaBosnia and HerzegovinaBrazilBulgariaBurma/MyanmarCabo VerdeCambodiaCameroonCanadaCaribbeanCentral AmericaChileChinaColombiaCongoCosta RicaCroatiaCubaCzechoslovakiaDenmarkDominicaDominican RepublicEastern AfricaEastern AsiaEastern EuropeEcuadorEgyptEl SalvadorEnglandEritreaEthiopiaEuropeFijiFranceGermanyGhanaGreeceGrenadaGuatemalaGuyanaHaitiHondurasHong KongHungaryIndiaIndonesiaIranIraqIrelandIsraelItalyJamaicaJapanJordanKenyaKoreaKuwaitLaosLatin AmericaLatviaLebanonLiberiaLithuaniaMalaysiaMexicoMicronesiaMiddle AfricaMoldovaMoroccoNepalNetherlandsNicaraguaNigeriaNorth AmericaNorth MacedoniaNorthern AfricaNorthern EuropeNorwayOceaniaPakistanPanamaPeruPhilippinesPolandPortugalRomaniaRussiaSaudi ArabiaScotlandSenegalSerbiaSierra LeoneSingaporeSomaliaSouth AfricaSouth AmericaSouth Central AsiaSouth Eastern AsiaSouthern EuropeSpainSri LankaSt. Vincent and the GrenadinesSudanSwedenSwitzerlandSyriaTaiwanThailandTrinidad and TobagoTurkeyUgandaUkraineUruguayUzbekistanVenezuelaVietnamWest IndiesWestern AfricaWestern AsiaWestern EuropeYemenZaireZimbabweAzores
Immigrants from Kazakhstan
Race
Ancestry
AfghanAfricanAlaska NativeAlaskan AthabascanAlbanianAleutAlsatianApacheArabArapahoArgentineanArmenianAssyrian/Chaldean/SyriacAustralianAustrianBahamianBangladeshiBarbadianBasqueBelgianBelizeanBermudanBhutaneseBlackfeetBolivianBrazilianBritishBritish West IndianBulgarianBurmeseCajunCambodianCanadianCape VerdeanCarpatho RusynCelticCentral AmericanCentral American IndianCherokeeCheyenneChickasawChileanChineseChippewaChoctawColombianColvilleComancheCosta RicanCreeCreekCroatianCrowCubanCypriotCzechCzechoslovakianDanishDelawareDominicanDutchDutch West IndianEastern EuropeanEcuadorianEgyptianEnglishEstonianEthiopianEuropeanFijianFilipinoFinnishFrenchFrench American IndianFrench CanadianGermanGerman RussianGhanaianGreekGuamanian/ChamorroGuatemalanGuyaneseHaitianHmongHonduranHopiHoumaHungarianIcelanderIndian (Asian)IndonesianInupiatIranianIraqiIrishIroquoisIsraeliItalianJamaicanJapaneseJordanianKenyanKiowaKoreanLaotianLatvianLebaneseLiberianLithuanianLumbeeLuxembourgerMacedonianMalaysianMalteseMarshalleseMenomineeMexicanMexican American IndianMongolianMoroccanNative HawaiianNavajoNepaleseNew ZealanderNicaraguanNigerianNorthern EuropeanNorwegianOkinawanOsageOttawaPaiutePakistaniPalestinianPanamanianParaguayanPennsylvania GermanPeruvianPimaPolishPortuguesePotawatomiPuebloPuerto RicanPuget Sound SalishRomanianRussianSalvadoranSamoanScandinavianScotch-IrishScottishSeminoleSenegaleseSerbianShoshoneSierra LeoneanSiouxSlavicSlovakSloveneSomaliSouth AfricanSouth AmericanSouth American IndianSoviet UnionSpaniardSpanishSpanish AmericanSpanish American IndianSri LankanSubsaharan AfricanSudaneseSwedishSwissSyrianTaiwaneseThaiTlingit-HaidaTohono O'OdhamTonganTrinidadian and TobagonianTsimshianTurkishU.S. Virgin IslanderUgandanUkrainianUruguayanUteVenezuelanVietnameseWelshWest IndianYakamaYaquiYugoslavianYumanYup'ikZimbabwean
Immigration
NonimmigrantsImmigrantsAfghanistanAfricaAlbaniaArgentinaArmeniaAsiaAustraliaAustriaBahamasBangladeshBarbadosBelarusBelgiumBelizeBoliviaBosnia and HerzegovinaBrazilBulgariaBurma/MyanmarCabo VerdeCambodiaCameroonCanadaCaribbeanCentral AmericaChileChinaColombiaCongoCosta RicaCroatiaCubaCzechoslovakiaDenmarkDominicaDominican RepublicEastern AfricaEastern AsiaEastern EuropeEcuadorEgyptEl SalvadorEnglandEritreaEthiopiaEuropeFijiFranceGermanyGhanaGreeceGrenadaGuatemalaGuyanaHaitiHondurasHong KongHungaryIndiaIndonesiaIranIraqIrelandIsraelItalyJamaicaJapanJordanKazakhstanKenyaKoreaKuwaitLaosLatin AmericaLatviaLebanonLiberiaLithuaniaMalaysiaMexicoMicronesiaMiddle AfricaMoldovaMoroccoNepalNetherlandsNicaraguaNigeriaNorth AmericaNorth MacedoniaNorthern AfricaNorthern EuropeNorwayOceaniaPakistanPanamaPeruPhilippinesPolandPortugalRomaniaRussiaSaudi ArabiaScotlandSenegalSerbiaSierra LeoneSingaporeSomaliaSouth AfricaSouth AmericaSouth Central AsiaSouth Eastern AsiaSouthern EuropeSpainSri LankaSt. Vincent and the GrenadinesSudanSwedenSwitzerlandSyriaTaiwanThailandTrinidad and TobagoTurkeyUgandaUkraineUruguayUzbekistanVenezuelaVietnamWest IndiesWestern AfricaWestern AsiaWestern EuropeYemenZaireZimbabweAzores
Professional Degree
Income
Poverty
Unemployment
Labor Participation
Family Structure
Vehicle Availability
Education Level
Disability

Professional Degree Comparison

Americans

Immigrants from Kazakhstan

Tragic
Exceptional
3.6%
PROFESSIONAL DEGREE
0.5/ 100
METRIC RATING
273rd/ 347
METRIC RANK
5.5%
PROFESSIONAL DEGREE
99.9/ 100
METRIC RATING
66th/ 347
METRIC RANK

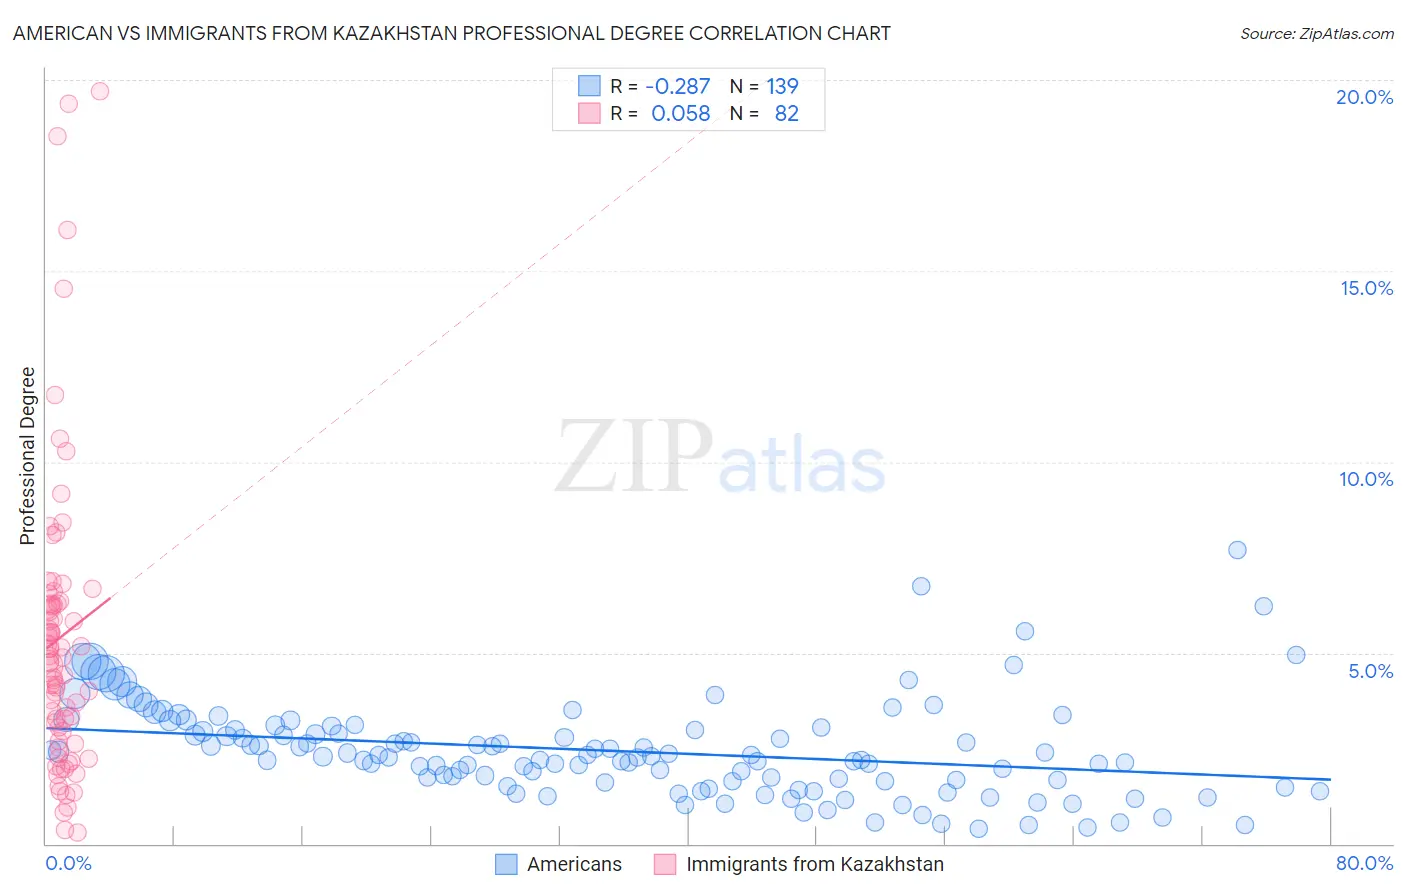
American vs Immigrants from Kazakhstan Professional Degree Correlation Chart

The statistical analysis conducted on geographies consisting of 570,969,920 people shows a weak negative correlation between the proportion of Americans and percentage of population with at least professional degree education in the United States with a correlation coefficient (R) of -0.287 and weighted average of 3.6%. Similarly, the statistical analysis conducted on geographies consisting of 124,400,013 people shows a slight positive correlation between the proportion of Immigrants from Kazakhstan and percentage of population with at least professional degree education in the United States with a correlation coefficient (R) of 0.058 and weighted average of 5.5%, a difference of 54.0%.
American vs Immigrants from Kazakhstan Professional Degree

Professional Degree Correlation Summary

MeasurementAmericanImmigrants from Kazakhstan
Minimum0.39%0.30%
Maximum7.7%19.7%
Range7.3%19.4%
Mean2.4%5.4%
Median2.3%4.8%
Interquartile 25% (IQ1)1.6%2.9%
Interquartile 75% (IQ3)3.0%6.3%
Interquartile Range (IQR)1.4%3.4%
Standard Deviation (Sample)1.2%3.9%
Standard Deviation (Population)1.2%3.9%

Similar Demographics by Professional Degree

Demographics Similar to Americans by Professional Degree

In terms of professional degree, the demographic groups most similar to Americans are Immigrants from Jamaica (3.6%, a difference of 0.060%), Belizean (3.6%, a difference of 0.090%), Potawatomi (3.6%, a difference of 0.13%), Immigrants from Dominica (3.6%, a difference of 0.35%), and Liberian (3.6%, a difference of 0.40%).
DemographicsRating | RankProfessional Degree
Central American Indians
0.8
/100
|
#266
Tragic
3.6%
Delaware
0.7
/100
|
#267
Tragic
3.6%
Aleuts
0.7
/100
|
#268
Tragic
3.6%
Immigrants | Cuba
0.6
/100
|
#269
Tragic
3.6%
Central Americans
0.6
/100
|
#270
Tragic
3.6%
Belizeans
0.5
/100
|
#271
Tragic
3.6%
Immigrants | Jamaica
0.5
/100
|
#272
Tragic
3.6%
Americans
0.5
/100
|
#273
Tragic
3.6%
Potawatomi
0.5
/100
|
#274
Tragic
3.6%
Immigrants | Dominica
0.5
/100
|
#275
Tragic
3.6%
Liberians
0.5
/100
|
#276
Tragic
3.6%
Cheyenne
0.5
/100
|
#277
Tragic
3.6%
Japanese
0.5
/100
|
#278
Tragic
3.5%
Immigrants | Portugal
0.5
/100
|
#279
Tragic
3.5%
Dominicans
0.5
/100
|
#280
Tragic
3.5%

Demographics Similar to Immigrants from Kazakhstan by Professional Degree

In terms of professional degree, the demographic groups most similar to Immigrants from Kazakhstan are Immigrants from Bolivia (5.5%, a difference of 0.24%), Immigrants from Asia (5.5%, a difference of 0.30%), Immigrants from Bulgaria (5.5%, a difference of 0.32%), Asian (5.5%, a difference of 0.36%), and Immigrants from Lebanon (5.5%, a difference of 0.51%).
DemographicsRating | RankProfessional Degree
Immigrants | Europe
100.0
/100
|
#59
Exceptional
5.6%
Bolivians
99.9
/100
|
#60
Exceptional
5.6%
Immigrants | Lithuania
99.9
/100
|
#61
Exceptional
5.6%
Immigrants | Belarus
99.9
/100
|
#62
Exceptional
5.5%
Asians
99.9
/100
|
#63
Exceptional
5.5%
Immigrants | Asia
99.9
/100
|
#64
Exceptional
5.5%
Immigrants | Bolivia
99.9
/100
|
#65
Exceptional
5.5%
Immigrants | Kazakhstan
99.9
/100
|
#66
Exceptional
5.5%
Immigrants | Bulgaria
99.9
/100
|
#67
Exceptional
5.5%
Immigrants | Lebanon
99.9
/100
|
#68
Exceptional
5.5%
Immigrants | Hungary
99.9
/100
|
#69
Exceptional
5.5%
Bhutanese
99.8
/100
|
#70
Exceptional
5.4%
Immigrants | Western Asia
99.8
/100
|
#71
Exceptional
5.4%
Lithuanians
99.8
/100
|
#72
Exceptional
5.4%
Immigrants | Romania
99.8
/100
|
#73
Exceptional
5.4%