Alsatian vs Immigrants from Brazil Bachelor's Degree
COMPARE
Alsatian
Immigrants from Brazil
Bachelor's Degree
Bachelor's Degree Comparison
Alsatians
Immigrants from Brazil
41.0%
BACHELOR'S DEGREE
97.0/ 100
METRIC RATING
106th/ 347
METRIC RANK
42.2%
BACHELOR'S DEGREE
99.2/ 100
METRIC RATING
86th/ 347
METRIC RANK
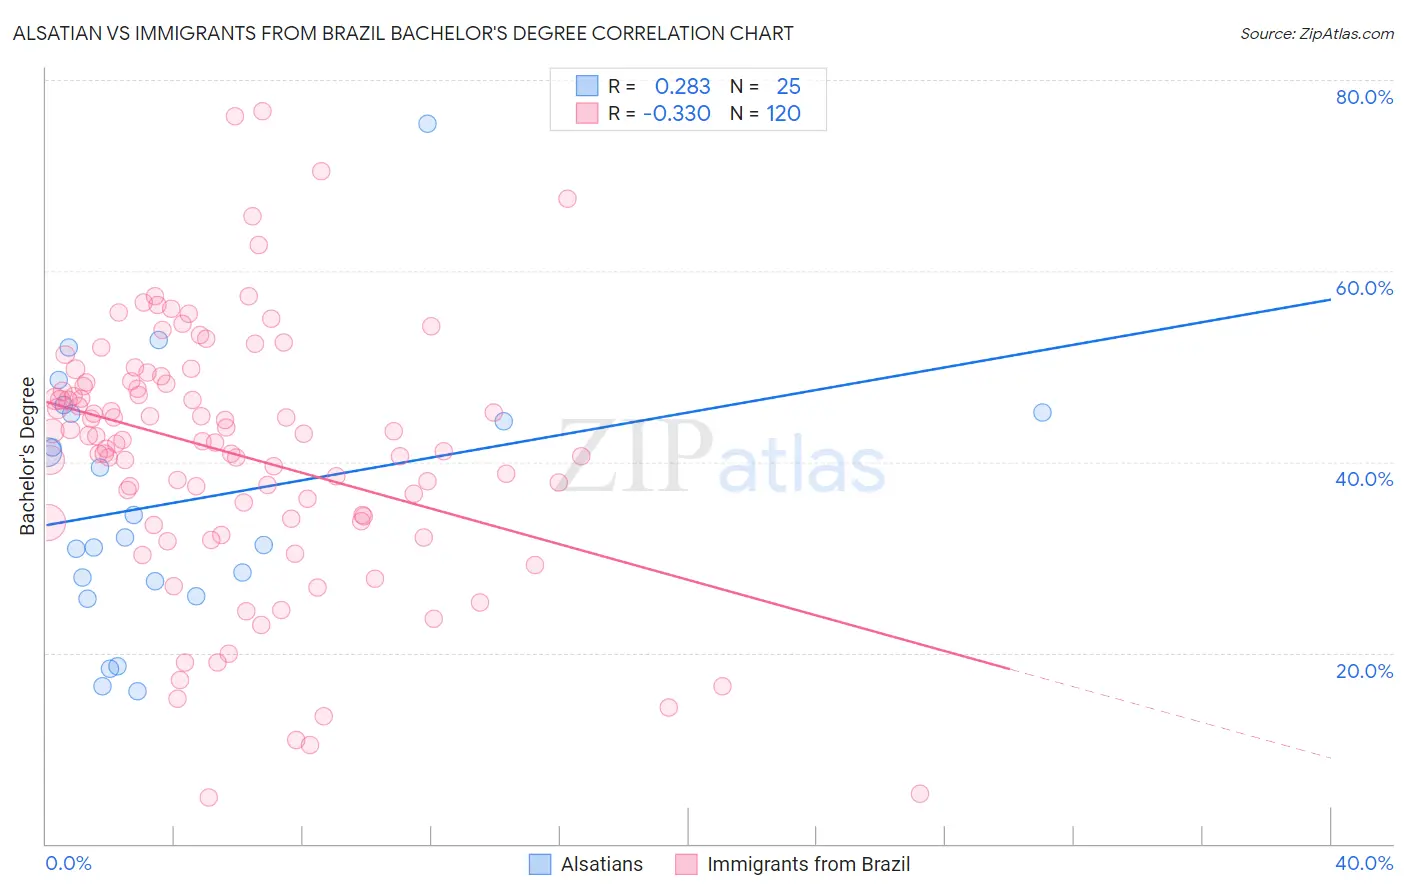
Alsatian vs Immigrants from Brazil Bachelor's Degree Correlation Chart
The statistical analysis conducted on geographies consisting of 82,682,365 people shows a weak positive correlation between the proportion of Alsatians and percentage of population with at least bachelor's degree education in the United States with a correlation coefficient (R) of 0.283 and weighted average of 41.0%. Similarly, the statistical analysis conducted on geographies consisting of 342,997,196 people shows a mild negative correlation between the proportion of Immigrants from Brazil and percentage of population with at least bachelor's degree education in the United States with a correlation coefficient (R) of -0.330 and weighted average of 42.2%, a difference of 2.9%.
Bachelor's Degree Correlation Summary
| Measurement | Alsatian | Immigrants from Brazil |
| Minimum | 16.0% | 4.8% |
| Maximum | 75.4% | 76.8% |
| Range | 59.4% | 72.0% |
| Mean | 35.8% | 40.8% |
| Median | 32.1% | 42.2% |
| Interquartile 25% (IQ1) | 26.7% | 33.9% |
| Interquartile 75% (IQ3) | 45.1% | 48.3% |
| Interquartile Range (IQR) | 18.4% | 14.3% |
| Standard Deviation (Sample) | 13.8% | 13.5% |
| Standard Deviation (Population) | 13.5% | 13.5% |
Demographics Similar to Alsatians and Immigrants from Brazil by Bachelor's Degree
In terms of bachelor's degree, the demographic groups most similar to Alsatians are Syrian (41.1%, a difference of 0.26%), Jordanian (41.2%, a difference of 0.29%), Chilean (41.2%, a difference of 0.35%), Immigrants from Italy (41.3%, a difference of 0.69%), and Immigrants from Morocco (41.4%, a difference of 0.96%). Similarly, the demographic groups most similar to Immigrants from Brazil are Carpatho Rusyn (42.1%, a difference of 0.30%), Immigrants from Western Europe (42.0%, a difference of 0.43%), Greek (42.0%, a difference of 0.43%), Laotian (42.0%, a difference of 0.55%), and Immigrants from Northern Africa (41.9%, a difference of 0.65%).
| Demographics | Rating | Rank | Bachelor's Degree |
| Immigrants | Brazil | 99.2 /100 | #86 | Exceptional 42.2% |
| Carpatho Rusyns | 99.0 /100 | #87 | Exceptional 42.1% |
| Immigrants | Western Europe | 99.0 /100 | #88 | Exceptional 42.0% |
| Greeks | 99.0 /100 | #89 | Exceptional 42.0% |
| Laotians | 98.9 /100 | #90 | Exceptional 42.0% |
| Immigrants | Northern Africa | 98.9 /100 | #91 | Exceptional 41.9% |
| Maltese | 98.8 /100 | #92 | Exceptional 41.9% |
| Immigrants | Canada | 98.6 /100 | #93 | Exceptional 41.7% |
| Immigrants | Nepal | 98.6 /100 | #94 | Exceptional 41.7% |
| Immigrants | North America | 98.5 /100 | #95 | Exceptional 41.7% |
| Immigrants | Moldova | 98.4 /100 | #96 | Exceptional 41.6% |
| Romanians | 98.4 /100 | #97 | Exceptional 41.6% |
| Immigrants | Ukraine | 98.3 /100 | #98 | Exceptional 41.5% |
| Immigrants | England | 98.1 /100 | #99 | Exceptional 41.4% |
| Macedonians | 98.1 /100 | #100 | Exceptional 41.4% |
| Immigrants | Morocco | 98.0 /100 | #101 | Exceptional 41.4% |
| Immigrants | Italy | 97.8 /100 | #102 | Exceptional 41.3% |
| Chileans | 97.5 /100 | #103 | Exceptional 41.2% |
| Jordanians | 97.4 /100 | #104 | Exceptional 41.2% |
| Syrians | 97.4 /100 | #105 | Exceptional 41.1% |
| Alsatians | 97.0 /100 | #106 | Exceptional 41.0% |