Aleut vs Paiute 11th Grade
COMPARE
Aleut
Paiute
11th Grade
11th Grade Comparison
Aleuts
Paiute
93.7%
11TH GRADE
99.5/ 100
METRIC RATING
77th/ 347
METRIC RANK
91.0%
11TH GRADE
0.1/ 100
METRIC RATING
273rd/ 347
METRIC RANK
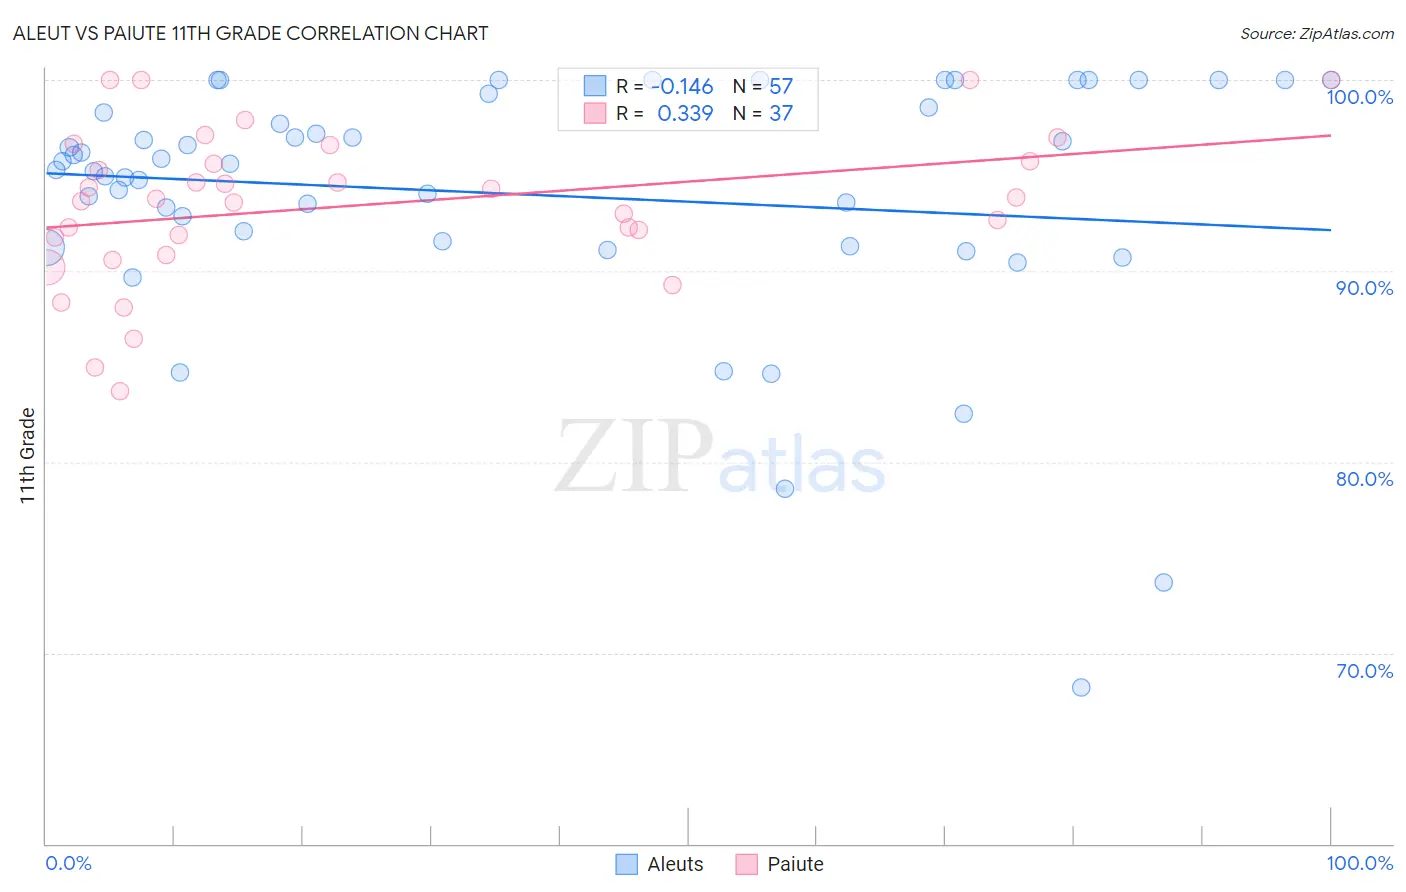
Aleut vs Paiute 11th Grade Correlation Chart
The statistical analysis conducted on geographies consisting of 61,782,880 people shows a poor negative correlation between the proportion of Aleuts and percentage of population with at least 11th grade education in the United States with a correlation coefficient (R) of -0.146 and weighted average of 93.7%. Similarly, the statistical analysis conducted on geographies consisting of 58,403,520 people shows a mild positive correlation between the proportion of Paiute and percentage of population with at least 11th grade education in the United States with a correlation coefficient (R) of 0.339 and weighted average of 91.0%, a difference of 3.0%.
11th Grade Correlation Summary
| Measurement | Aleut | Paiute |
| Minimum | 68.2% | 83.7% |
| Maximum | 100.0% | 100.0% |
| Range | 31.8% | 16.3% |
| Mean | 94.0% | 93.4% |
| Median | 95.6% | 93.8% |
| Interquartile 25% (IQ1) | 91.4% | 91.3% |
| Interquartile 75% (IQ3) | 98.9% | 96.2% |
| Interquartile Range (IQR) | 7.5% | 4.9% |
| Standard Deviation (Sample) | 6.6% | 4.0% |
| Standard Deviation (Population) | 6.5% | 4.0% |
Similar Demographics by 11th Grade
Demographics Similar to Aleuts by 11th Grade
In terms of 11th grade, the demographic groups most similar to Aleuts are Celtic (93.7%, a difference of 0.0%), Soviet Union (93.7%, a difference of 0.0%), Immigrants from Denmark (93.7%, a difference of 0.010%), Immigrants from Latvia (93.8%, a difference of 0.030%), and Canadian (93.7%, a difference of 0.030%).
| Demographics | Rating | Rank | 11th Grade |
| Immigrants | England | 99.7 /100 | #70 | Exceptional 93.8% |
| Immigrants | South Africa | 99.7 /100 | #71 | Exceptional 93.8% |
| Immigrants | Japan | 99.7 /100 | #72 | Exceptional 93.8% |
| Romanians | 99.6 /100 | #73 | Exceptional 93.8% |
| Immigrants | Czechoslovakia | 99.6 /100 | #74 | Exceptional 93.8% |
| Immigrants | Latvia | 99.6 /100 | #75 | Exceptional 93.8% |
| Celtics | 99.5 /100 | #76 | Exceptional 93.7% |
| Aleuts | 99.5 /100 | #77 | Exceptional 93.7% |
| Soviet Union | 99.5 /100 | #78 | Exceptional 93.7% |
| Immigrants | Denmark | 99.5 /100 | #79 | Exceptional 93.7% |
| Canadians | 99.5 /100 | #80 | Exceptional 93.7% |
| Immigrants | Moldova | 99.5 /100 | #81 | Exceptional 93.7% |
| Immigrants | Saudi Arabia | 99.3 /100 | #82 | Exceptional 93.7% |
| Icelanders | 99.3 /100 | #83 | Exceptional 93.6% |
| Immigrants | Taiwan | 99.3 /100 | #84 | Exceptional 93.6% |
Demographics Similar to Paiute by 11th Grade
In terms of 11th grade, the demographic groups most similar to Paiute are Immigrants from Trinidad and Tobago (90.9%, a difference of 0.040%), Immigrants from Peru (91.0%, a difference of 0.050%), West Indian (91.0%, a difference of 0.050%), Immigrants from South Eastern Asia (90.9%, a difference of 0.050%), and Trinidadian and Tobagonian (91.1%, a difference of 0.080%).
| Demographics | Rating | Rank | 11th Grade |
| Immigrants | Western Africa | 0.3 /100 | #266 | Tragic 91.2% |
| Immigrants | Jamaica | 0.3 /100 | #267 | Tragic 91.2% |
| U.S. Virgin Islanders | 0.2 /100 | #268 | Tragic 91.1% |
| Ute | 0.2 /100 | #269 | Tragic 91.1% |
| Trinidadians and Tobagonians | 0.2 /100 | #270 | Tragic 91.1% |
| Immigrants | Peru | 0.1 /100 | #271 | Tragic 91.0% |
| West Indians | 0.1 /100 | #272 | Tragic 91.0% |
| Paiute | 0.1 /100 | #273 | Tragic 91.0% |
| Immigrants | Trinidad and Tobago | 0.1 /100 | #274 | Tragic 90.9% |
| Immigrants | South Eastern Asia | 0.1 /100 | #275 | Tragic 90.9% |
| Bangladeshis | 0.1 /100 | #276 | Tragic 90.9% |
| Immigrants | Congo | 0.1 /100 | #277 | Tragic 90.9% |
| Malaysians | 0.1 /100 | #278 | Tragic 90.8% |
| Barbadians | 0.0 /100 | #279 | Tragic 90.8% |
| Sri Lankans | 0.0 /100 | #280 | Tragic 90.7% |