Aleut vs Cherokee 7th Grade

COMPARE

Aleut
Race
Ancestry
AfghanAfricanAlaska NativeAlaskan AthabascanAlbanianAleutAlsatianAmericanApacheArabArapahoArgentineanArmenianAssyrian/Chaldean/SyriacAustralianAustrianBahamianBangladeshiBarbadianBasqueBelgianBelizeanBermudanBhutaneseBlackfeetBolivianBrazilianBritishBritish West IndianBulgarianBurmeseCajunCambodianCanadianCape VerdeanCarpatho RusynCelticCentral AmericanCentral American IndianCheyenneChickasawChileanChineseChippewaChoctawColombianColvilleComancheCosta RicanCreeCreekCroatianCrowCubanCypriotCzechCzechoslovakianDanishDelawareDominicanDutchDutch West IndianEastern EuropeanEcuadorianEgyptianEnglishEstonianEthiopianEuropeanFijianFilipinoFinnishFrenchFrench American IndianFrench CanadianGermanGerman RussianGhanaianGreekGuamanian/ChamorroGuatemalanGuyaneseHaitianHmongHonduranHopiHoumaHungarianIcelanderIndian (Asian)IndonesianInupiatIranianIraqiIrishIroquoisIsraeliItalianJamaicanJapaneseJordanianKenyanKiowaKoreanLaotianLatvianLebaneseLiberianLithuanianLumbeeLuxembourgerMacedonianMalaysianMalteseMarshalleseMenomineeMexicanMexican American IndianMongolianMoroccanNative HawaiianNavajoNepaleseNew ZealanderNicaraguanNigerianNorthern EuropeanNorwegianOkinawanOsageOttawaPaiutePakistaniPalestinianPanamanianParaguayanPennsylvania GermanPeruvianPimaPolishPortuguesePotawatomiPuebloPuerto RicanPuget Sound SalishRomanianRussianSalvadoranSamoanScandinavianScotch-IrishScottishSeminoleSenegaleseSerbianShoshoneSierra LeoneanSiouxSlavicSlovakSloveneSomaliSouth AfricanSouth AmericanSouth American IndianSoviet UnionSpaniardSpanishSpanish AmericanSpanish American IndianSri LankanSubsaharan AfricanSudaneseSwedishSwissSyrianTaiwaneseThaiTlingit-HaidaTohono O'OdhamTonganTrinidadian and TobagonianTsimshianTurkishU.S. Virgin IslanderUgandanUkrainianUruguayanUteVenezuelanVietnameseWelshWest IndianYakamaYaquiYugoslavianYumanYup'ikZimbabwean
Immigration
NonimmigrantsImmigrantsAfghanistanAfricaAlbaniaArgentinaArmeniaAsiaAustraliaAustriaBahamasBangladeshBarbadosBelarusBelgiumBelizeBoliviaBosnia and HerzegovinaBrazilBulgariaBurma/MyanmarCabo VerdeCambodiaCameroonCanadaCaribbeanCentral AmericaChileChinaColombiaCongoCosta RicaCroatiaCubaCzechoslovakiaDenmarkDominicaDominican RepublicEastern AfricaEastern AsiaEastern EuropeEcuadorEgyptEl SalvadorEnglandEritreaEthiopiaEuropeFijiFranceGermanyGhanaGreeceGrenadaGuatemalaGuyanaHaitiHondurasHong KongHungaryIndiaIndonesiaIranIraqIrelandIsraelItalyJamaicaJapanJordanKazakhstanKenyaKoreaKuwaitLaosLatin AmericaLatviaLebanonLiberiaLithuaniaMalaysiaMexicoMicronesiaMiddle AfricaMoldovaMoroccoNepalNetherlandsNicaraguaNigeriaNorth AmericaNorth MacedoniaNorthern AfricaNorthern EuropeNorwayOceaniaPakistanPanamaPeruPhilippinesPolandPortugalRomaniaRussiaSaudi ArabiaScotlandSenegalSerbiaSierra LeoneSingaporeSomaliaSouth AfricaSouth AmericaSouth Central AsiaSouth Eastern AsiaSouthern EuropeSpainSri LankaSt. Vincent and the GrenadinesSudanSwedenSwitzerlandSyriaTaiwanThailandTrinidad and TobagoTurkeyUgandaUkraineUruguayUzbekistanVenezuelaVietnamWest IndiesWestern AfricaWestern AsiaWestern EuropeYemenZaireZimbabweAzores
Cherokee
Race
Ancestry
AfghanAfricanAlaska NativeAlaskan AthabascanAlbanianAlsatianAmericanApacheArabArapahoArgentineanArmenianAssyrian/Chaldean/SyriacAustralianAustrianBahamianBangladeshiBarbadianBasqueBelgianBelizeanBermudanBhutaneseBlackfeetBolivianBrazilianBritishBritish West IndianBulgarianBurmeseCajunCambodianCanadianCape VerdeanCarpatho RusynCelticCentral AmericanCentral American IndianCherokeeCheyenneChickasawChileanChineseChippewaChoctawColombianColvilleComancheCosta RicanCreeCreekCroatianCrowCubanCypriotCzechCzechoslovakianDanishDelawareDominicanDutchDutch West IndianEastern EuropeanEcuadorianEgyptianEnglishEstonianEthiopianEuropeanFijianFilipinoFinnishFrenchFrench American IndianFrench CanadianGermanGerman RussianGhanaianGreekGuamanian/ChamorroGuatemalanGuyaneseHaitianHmongHonduranHopiHoumaHungarianIcelanderIndian (Asian)IndonesianInupiatIranianIraqiIrishIroquoisIsraeliItalianJamaicanJapaneseJordanianKenyanKiowaKoreanLaotianLatvianLebaneseLiberianLithuanianLumbeeLuxembourgerMacedonianMalaysianMalteseMarshalleseMenomineeMexicanMexican American IndianMongolianMoroccanNative HawaiianNavajoNepaleseNew ZealanderNicaraguanNigerianNorthern EuropeanNorwegianOkinawanOsageOttawaPaiutePakistaniPalestinianPanamanianParaguayanPennsylvania GermanPeruvianPimaPolishPortuguesePotawatomiPuebloPuerto RicanPuget Sound SalishRomanianRussianSalvadoranSamoanScandinavianScotch-IrishScottishSeminoleSenegaleseSerbianShoshoneSierra LeoneanSiouxSlavicSlovakSloveneSomaliSouth AfricanSouth AmericanSouth American IndianSoviet UnionSpaniardSpanishSpanish AmericanSpanish American IndianSri LankanSubsaharan AfricanSudaneseSwedishSwissSyrianTaiwaneseThaiTlingit-HaidaTohono O'OdhamTonganTrinidadian and TobagonianTsimshianTurkishU.S. Virgin IslanderUgandanUkrainianUruguayanUteVenezuelanVietnameseWelshWest IndianYakamaYaquiYugoslavianYumanYup'ikZimbabwean
Immigration
NonimmigrantsImmigrantsAfghanistanAfricaAlbaniaArgentinaArmeniaAsiaAustraliaAustriaBahamasBangladeshBarbadosBelarusBelgiumBelizeBoliviaBosnia and HerzegovinaBrazilBulgariaBurma/MyanmarCabo VerdeCambodiaCameroonCanadaCaribbeanCentral AmericaChileChinaColombiaCongoCosta RicaCroatiaCubaCzechoslovakiaDenmarkDominicaDominican RepublicEastern AfricaEastern AsiaEastern EuropeEcuadorEgyptEl SalvadorEnglandEritreaEthiopiaEuropeFijiFranceGermanyGhanaGreeceGrenadaGuatemalaGuyanaHaitiHondurasHong KongHungaryIndiaIndonesiaIranIraqIrelandIsraelItalyJamaicaJapanJordanKazakhstanKenyaKoreaKuwaitLaosLatin AmericaLatviaLebanonLiberiaLithuaniaMalaysiaMexicoMicronesiaMiddle AfricaMoldovaMoroccoNepalNetherlandsNicaraguaNigeriaNorth AmericaNorth MacedoniaNorthern AfricaNorthern EuropeNorwayOceaniaPakistanPanamaPeruPhilippinesPolandPortugalRomaniaRussiaSaudi ArabiaScotlandSenegalSerbiaSierra LeoneSingaporeSomaliaSouth AfricaSouth AmericaSouth Central AsiaSouth Eastern AsiaSouthern EuropeSpainSri LankaSt. Vincent and the GrenadinesSudanSwedenSwitzerlandSyriaTaiwanThailandTrinidad and TobagoTurkeyUgandaUkraineUruguayUzbekistanVenezuelaVietnamWest IndiesWestern AfricaWestern AsiaWestern EuropeYemenZaireZimbabweAzores
7th Grade
Income
Poverty
Unemployment
Labor Participation
Family Structure
Vehicle Availability
Education Level
Disability

7th Grade Comparison

Aleuts

Cherokee

Exceptional
Exceptional
97.1%
7TH GRADE
99.9/ 100
METRIC RATING
46th/ 347
METRIC RANK
96.8%
7TH GRADE
99.4/ 100
METRIC RATING
77th/ 347
METRIC RANK

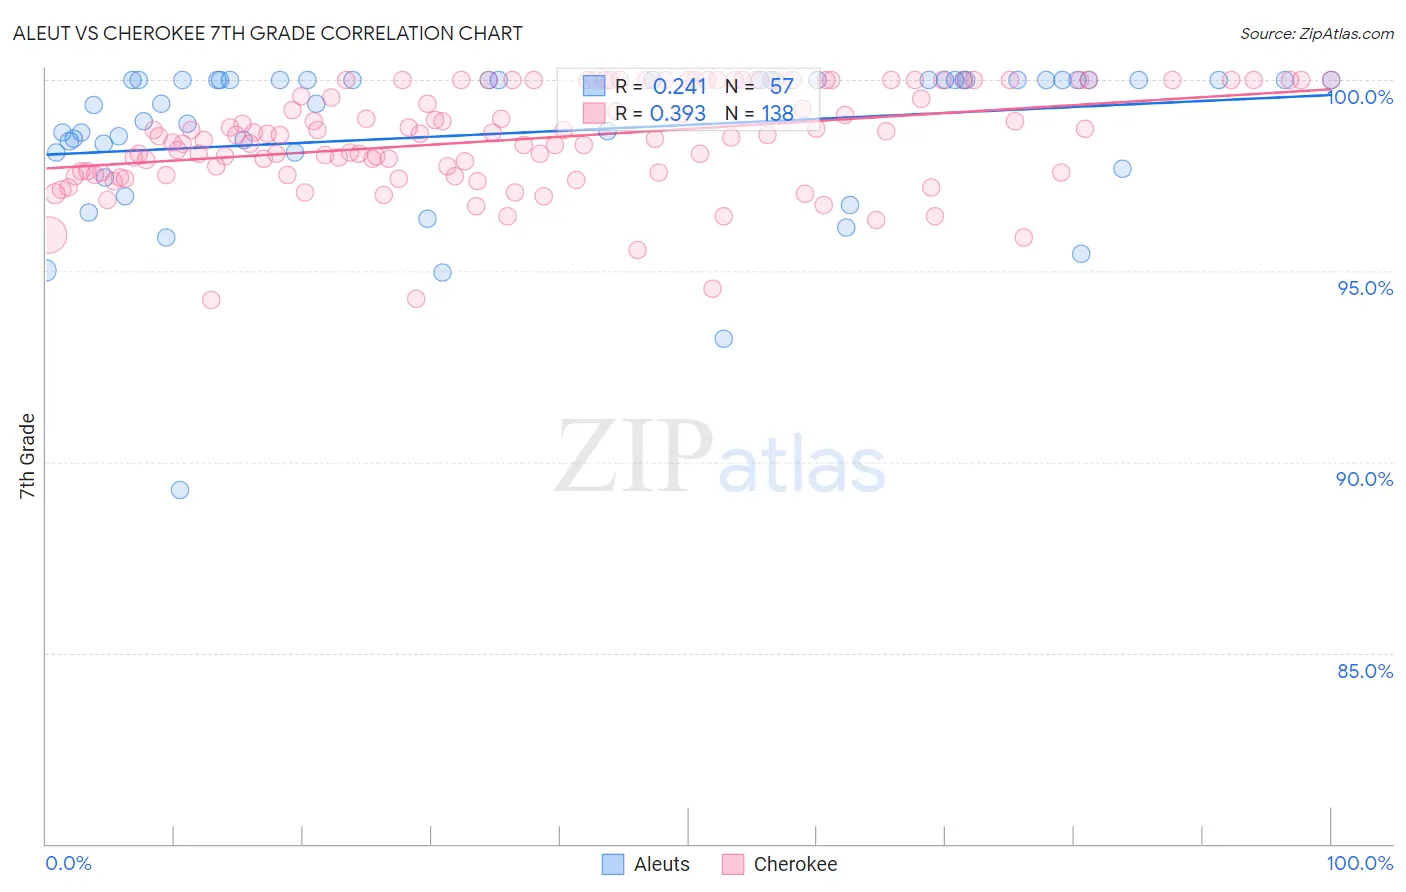
Aleut vs Cherokee 7th Grade Correlation Chart

The statistical analysis conducted on geographies consisting of 61,782,786 people shows a weak positive correlation between the proportion of Aleuts and percentage of population with at least 7th grade education in the United States with a correlation coefficient (R) of 0.241 and weighted average of 97.1%. Similarly, the statistical analysis conducted on geographies consisting of 493,719,571 people shows a mild positive correlation between the proportion of Cherokee and percentage of population with at least 7th grade education in the United States with a correlation coefficient (R) of 0.393 and weighted average of 96.8%, a difference of 0.32%.
Aleut vs Cherokee 7th Grade

7th Grade Correlation Summary

MeasurementAleutCherokee
Minimum89.3%94.2%
Maximum100.0%100.0%
Range10.7%5.8%
Mean98.6%98.5%
Median100.0%98.6%
Interquartile 25% (IQ1)98.1%97.6%
Interquartile 75% (IQ3)100.0%100.0%
Interquartile Range (IQR)1.9%2.4%
Standard Deviation (Sample)2.1%1.3%
Standard Deviation (Population)2.1%1.3%

Similar Demographics by 7th Grade

Demographics Similar to Aleuts by 7th Grade

In terms of 7th grade, the demographic groups most similar to Aleuts are Czechoslovakian (97.1%, a difference of 0.0%), Maltese (97.1%, a difference of 0.010%), Northern European (97.1%, a difference of 0.010%), Bulgarian (97.1%, a difference of 0.020%), and Celtic (97.1%, a difference of 0.030%).
DemographicsRating | Rank7th Grade
Latvians
100.0
/100
|
#39
Exceptional
97.2%
Luxembourgers
100.0
/100
|
#40
Exceptional
97.2%
Eastern Europeans
100.0
/100
|
#41
Exceptional
97.2%
Chinese
99.9
/100
|
#42
Exceptional
97.1%
Maltese
99.9
/100
|
#43
Exceptional
97.1%
Northern Europeans
99.9
/100
|
#44
Exceptional
97.1%
Czechoslovakians
99.9
/100
|
#45
Exceptional
97.1%
Aleuts
99.9
/100
|
#46
Exceptional
97.1%
Bulgarians
99.9
/100
|
#47
Exceptional
97.1%
Celtics
99.9
/100
|
#48
Exceptional
97.1%
Slavs
99.9
/100
|
#49
Exceptional
97.1%
Immigrants | Scotland
99.9
/100
|
#50
Exceptional
97.1%
Estonians
99.9
/100
|
#51
Exceptional
97.0%
Greeks
99.9
/100
|
#52
Exceptional
97.0%
Austrians
99.8
/100
|
#53
Exceptional
97.0%

Demographics Similar to Cherokee by 7th Grade

In terms of 7th grade, the demographic groups most similar to Cherokee are Immigrants from Ireland (96.8%, a difference of 0.0%), Immigrants from Netherlands (96.8%, a difference of 0.010%), Cypriot (96.8%, a difference of 0.010%), Yugoslavian (96.8%, a difference of 0.010%), and Zimbabwean (96.8%, a difference of 0.020%).
DemographicsRating | Rank7th Grade
New Zealanders
99.6
/100
|
#70
Exceptional
96.8%
Immigrants | Lithuania
99.6
/100
|
#71
Exceptional
96.8%
Cajuns
99.5
/100
|
#72
Exceptional
96.8%
Arapaho
99.5
/100
|
#73
Exceptional
96.8%
Immigrants | England
99.5
/100
|
#74
Exceptional
96.8%
Zimbabweans
99.5
/100
|
#75
Exceptional
96.8%
Immigrants | Ireland
99.4
/100
|
#76
Exceptional
96.8%
Cherokee
99.4
/100
|
#77
Exceptional
96.8%
Immigrants | Netherlands
99.3
/100
|
#78
Exceptional
96.8%
Cypriots
99.3
/100
|
#79
Exceptional
96.8%
Yugoslavians
99.3
/100
|
#80
Exceptional
96.8%
Delaware
99.2
/100
|
#81
Exceptional
96.8%
Chickasaw
99.2
/100
|
#82
Exceptional
96.7%
Icelanders
99.1
/100
|
#83
Exceptional
96.7%
Romanians
99.1
/100
|
#84
Exceptional
96.7%