Alaskan Athabascan vs Ghanaian 10th Grade
COMPARE
Alaskan Athabascan
Ghanaian
10th Grade
10th Grade Comparison
Alaskan Athabascans
Ghanaians
95.4%
10TH GRADE
100.0/ 100
METRIC RATING
27th/ 347
METRIC RANK
92.8%
10TH GRADE
0.9/ 100
METRIC RATING
253rd/ 347
METRIC RANK
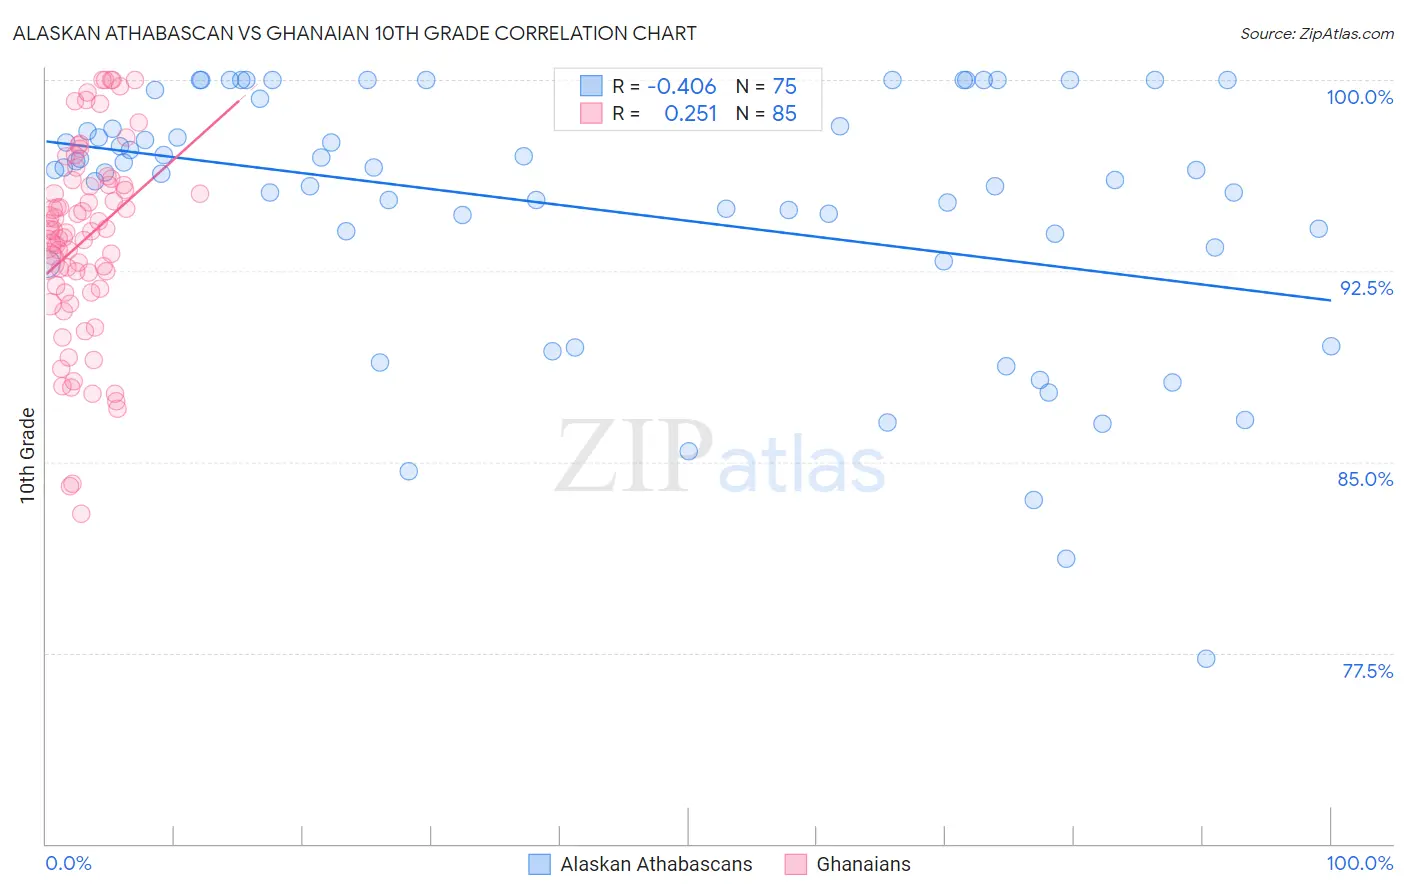
Alaskan Athabascan vs Ghanaian 10th Grade Correlation Chart
The statistical analysis conducted on geographies consisting of 45,820,444 people shows a moderate negative correlation between the proportion of Alaskan Athabascans and percentage of population with at least 10th grade education in the United States with a correlation coefficient (R) of -0.406 and weighted average of 95.4%. Similarly, the statistical analysis conducted on geographies consisting of 190,714,671 people shows a weak positive correlation between the proportion of Ghanaians and percentage of population with at least 10th grade education in the United States with a correlation coefficient (R) of 0.251 and weighted average of 92.8%, a difference of 2.9%.
10th Grade Correlation Summary
| Measurement | Alaskan Athabascan | Ghanaian |
| Minimum | 77.3% | 83.0% |
| Maximum | 100.0% | 100.0% |
| Range | 22.7% | 17.0% |
| Mean | 94.9% | 93.7% |
| Median | 96.4% | 94.1% |
| Interquartile 25% (IQ1) | 93.4% | 91.7% |
| Interquartile 75% (IQ3) | 98.2% | 96.0% |
| Interquartile Range (IQR) | 4.8% | 4.3% |
| Standard Deviation (Sample) | 5.1% | 3.8% |
| Standard Deviation (Population) | 5.1% | 3.8% |
Similar Demographics by 10th Grade
Demographics Similar to Alaskan Athabascans by 10th Grade
In terms of 10th grade, the demographic groups most similar to Alaskan Athabascans are Luxembourger (95.4%, a difference of 0.0%), Welsh (95.5%, a difference of 0.020%), Bulgarian (95.4%, a difference of 0.030%), European (95.5%, a difference of 0.040%), and Maltese (95.5%, a difference of 0.040%).
| Demographics | Rating | Rank | 10th Grade |
| Chinese | 100.0 /100 | #20 | Exceptional 95.5% |
| Dutch | 100.0 /100 | #21 | Exceptional 95.5% |
| Eastern Europeans | 100.0 /100 | #22 | Exceptional 95.5% |
| Czechs | 100.0 /100 | #23 | Exceptional 95.5% |
| Europeans | 100.0 /100 | #24 | Exceptional 95.5% |
| Maltese | 100.0 /100 | #25 | Exceptional 95.5% |
| Welsh | 100.0 /100 | #26 | Exceptional 95.5% |
| Alaskan Athabascans | 100.0 /100 | #27 | Exceptional 95.4% |
| Luxembourgers | 100.0 /100 | #28 | Exceptional 95.4% |
| Bulgarians | 100.0 /100 | #29 | Exceptional 95.4% |
| Belgians | 100.0 /100 | #30 | Exceptional 95.4% |
| Iranians | 100.0 /100 | #31 | Exceptional 95.3% |
| Hungarians | 100.0 /100 | #32 | Exceptional 95.3% |
| French | 100.0 /100 | #33 | Exceptional 95.3% |
| British | 99.9 /100 | #34 | Exceptional 95.3% |
Demographics Similar to Ghanaians by 10th Grade
In terms of 10th grade, the demographic groups most similar to Ghanaians are South American (92.8%, a difference of 0.0%), Immigrants from Thailand (92.8%, a difference of 0.010%), Armenian (92.7%, a difference of 0.010%), Jamaican (92.8%, a difference of 0.060%), and Immigrants from Bolivia (92.7%, a difference of 0.060%).
| Demographics | Rating | Rank | 10th Grade |
| Immigrants | Middle Africa | 1.7 /100 | #246 | Tragic 92.9% |
| Immigrants | Afghanistan | 1.4 /100 | #247 | Tragic 92.8% |
| Colombians | 1.4 /100 | #248 | Tragic 92.8% |
| Immigrants | Senegal | 1.4 /100 | #249 | Tragic 92.8% |
| Jamaicans | 1.2 /100 | #250 | Tragic 92.8% |
| Immigrants | Thailand | 1.0 /100 | #251 | Tragic 92.8% |
| South Americans | 0.9 /100 | #252 | Tragic 92.8% |
| Ghanaians | 0.9 /100 | #253 | Tragic 92.8% |
| Armenians | 0.9 /100 | #254 | Tragic 92.7% |
| Immigrants | Bolivia | 0.7 /100 | #255 | Tragic 92.7% |
| Immigrants | Nigeria | 0.7 /100 | #256 | Tragic 92.7% |
| U.S. Virgin Islanders | 0.7 /100 | #257 | Tragic 92.7% |
| Immigrants | Costa Rica | 0.6 /100 | #258 | Tragic 92.7% |
| Immigrants | Jamaica | 0.5 /100 | #259 | Tragic 92.6% |
| Immigrants | Uzbekistan | 0.5 /100 | #260 | Tragic 92.6% |