Alaska Native vs Cheyenne Master's Degree
COMPARE
Alaska Native
Cheyenne
Master's Degree
Master's Degree Comparison
Alaska Natives
Cheyenne
11.6%
MASTER'S DEGREE
0.1/ 100
METRIC RATING
293rd/ 347
METRIC RANK
11.2%
MASTER'S DEGREE
0.0/ 100
METRIC RATING
307th/ 347
METRIC RANK
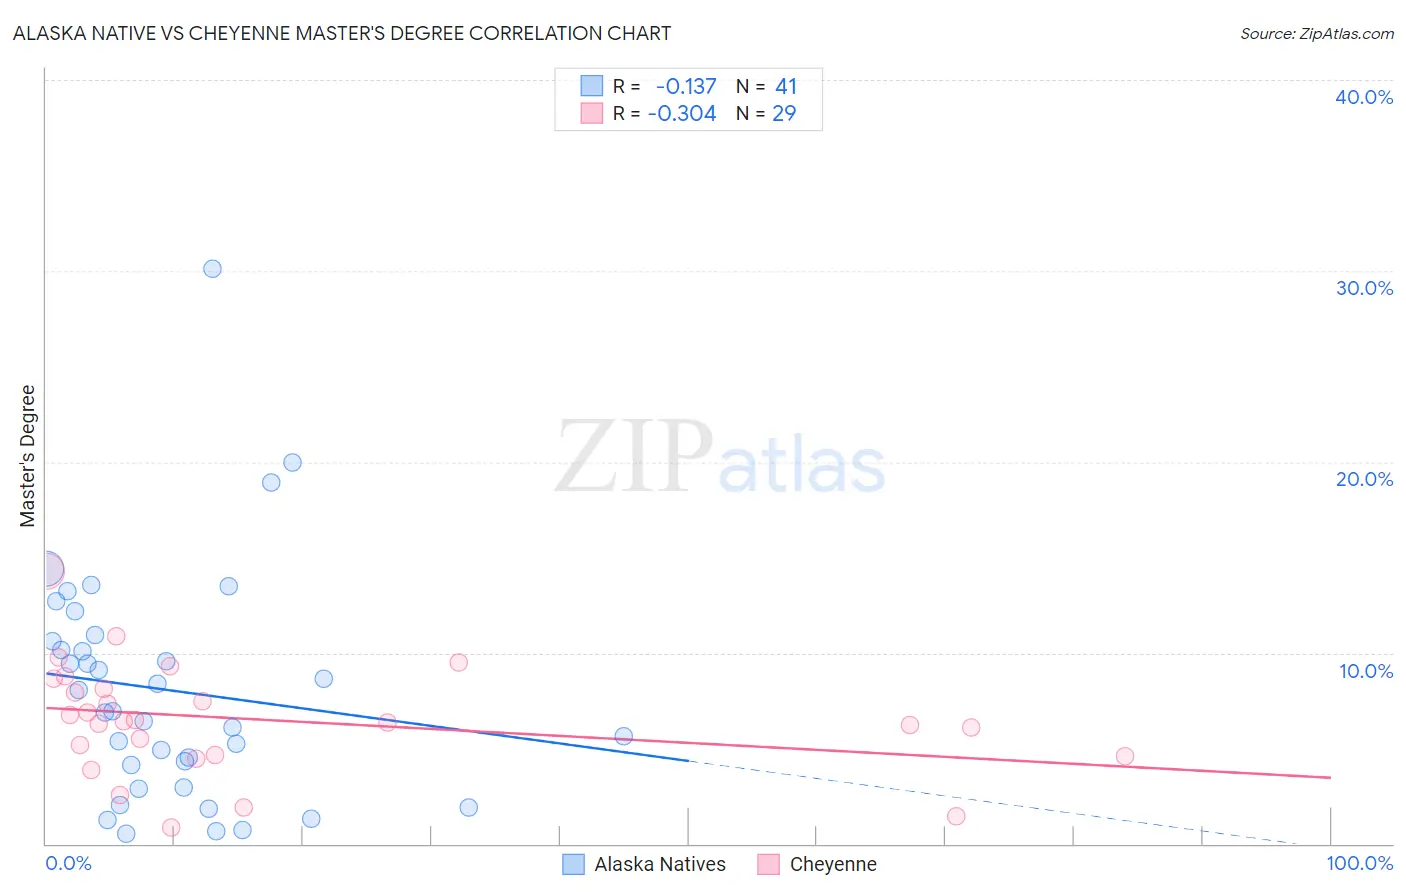
Alaska Native vs Cheyenne Master's Degree Correlation Chart
The statistical analysis conducted on geographies consisting of 76,746,522 people shows a poor negative correlation between the proportion of Alaska Natives and percentage of population with at least master's degree education in the United States with a correlation coefficient (R) of -0.137 and weighted average of 11.6%. Similarly, the statistical analysis conducted on geographies consisting of 80,705,312 people shows a mild negative correlation between the proportion of Cheyenne and percentage of population with at least master's degree education in the United States with a correlation coefficient (R) of -0.304 and weighted average of 11.2%, a difference of 3.3%.
Master's Degree Correlation Summary
| Measurement | Alaska Native | Cheyenne |
| Minimum | 0.50% | 0.84% |
| Maximum | 30.1% | 14.3% |
| Range | 29.6% | 13.5% |
| Mean | 8.0% | 6.5% |
| Median | 7.0% | 6.4% |
| Interquartile 25% (IQ1) | 3.5% | 4.6% |
| Interquartile 75% (IQ3) | 10.8% | 8.4% |
| Interquartile Range (IQR) | 7.2% | 3.8% |
| Standard Deviation (Sample) | 6.0% | 2.9% |
| Standard Deviation (Population) | 5.9% | 2.9% |
Demographics Similar to Alaska Natives and Cheyenne by Master's Degree
In terms of master's degree, the demographic groups most similar to Alaska Natives are Hawaiian (11.6%, a difference of 0.10%), Immigrants from Guatemala (11.6%, a difference of 0.23%), Marshallese (11.6%, a difference of 0.25%), Alaskan Athabascan (11.6%, a difference of 0.26%), and Colville (11.6%, a difference of 0.35%). Similarly, the demographic groups most similar to Cheyenne are Mexican American Indian (11.2%, a difference of 0.15%), Immigrants from Latin America (11.3%, a difference of 0.34%), Puerto Rican (11.2%, a difference of 0.55%), Puget Sound Salish (11.1%, a difference of 0.84%), and Immigrants from Cabo Verde (11.3%, a difference of 0.99%).
| Demographics | Rating | Rank | Master's Degree |
| Ute | 0.1 /100 | #290 | Tragic 11.7% |
| Colville | 0.1 /100 | #291 | Tragic 11.6% |
| Immigrants | Guatemala | 0.1 /100 | #292 | Tragic 11.6% |
| Alaska Natives | 0.1 /100 | #293 | Tragic 11.6% |
| Hawaiians | 0.1 /100 | #294 | Tragic 11.6% |
| Marshallese | 0.1 /100 | #295 | Tragic 11.6% |
| Alaskan Athabascans | 0.1 /100 | #296 | Tragic 11.6% |
| Immigrants | Yemen | 0.1 /100 | #297 | Tragic 11.6% |
| Samoans | 0.1 /100 | #298 | Tragic 11.5% |
| Chickasaw | 0.1 /100 | #299 | Tragic 11.4% |
| Chippewa | 0.1 /100 | #300 | Tragic 11.4% |
| Tsimshian | 0.1 /100 | #301 | Tragic 11.4% |
| Cherokee | 0.1 /100 | #302 | Tragic 11.4% |
| Immigrants | Laos | 0.1 /100 | #303 | Tragic 11.4% |
| Immigrants | Cabo Verde | 0.1 /100 | #304 | Tragic 11.3% |
| Immigrants | Latin America | 0.0 /100 | #305 | Tragic 11.3% |
| Mexican American Indians | 0.0 /100 | #306 | Tragic 11.2% |
| Cheyenne | 0.0 /100 | #307 | Tragic 11.2% |
| Puerto Ricans | 0.0 /100 | #308 | Tragic 11.2% |
| Puget Sound Salish | 0.0 /100 | #309 | Tragic 11.1% |
| Shoshone | 0.0 /100 | #310 | Tragic 11.1% |