African vs Puget Sound Salish 2nd Grade

COMPARE

African
Race
Ancestry
AfghanAfricanAlaska NativeAlaskan AthabascanAlbanianAleutAlsatianAmericanApacheArabArapahoArgentineanArmenianAssyrian/Chaldean/SyriacAustralianAustrianBahamianBangladeshiBarbadianBasqueBelgianBelizeanBermudanBhutaneseBlackfeetBolivianBrazilianBritishBritish West IndianBulgarianBurmeseCajunCambodianCanadianCape VerdeanCarpatho RusynCelticCentral AmericanCentral American IndianCherokeeCheyenneChickasawChileanChineseChippewaChoctawColombianColvilleComancheCosta RicanCreeCreekCroatianCrowCubanCypriotCzechCzechoslovakianDanishDelawareDominicanDutchDutch West IndianEastern EuropeanEcuadorianEgyptianEnglishEstonianEthiopianEuropeanFijianFilipinoFinnishFrenchFrench American IndianFrench CanadianGermanGerman RussianGhanaianGreekGuamanian/ChamorroGuatemalanGuyaneseHaitianHmongHonduranHopiHoumaHungarianIcelanderIndian (Asian)IndonesianInupiatIranianIraqiIrishIroquoisIsraeliItalianJamaicanJapaneseJordanianKenyanKiowaKoreanLaotianLatvianLebaneseLiberianLithuanianLumbeeLuxembourgerMacedonianMalaysianMalteseMarshalleseMenomineeMexicanMexican American IndianMongolianMoroccanNative HawaiianNavajoNepaleseNew ZealanderNicaraguanNigerianNorthern EuropeanNorwegianOkinawanOsageOttawaPaiutePakistaniPalestinianPanamanianParaguayanPennsylvania GermanPeruvianPimaPolishPortuguesePotawatomiPuebloPuerto RicanRomanianRussianSalvadoranSamoanScandinavianScotch-IrishScottishSeminoleSenegaleseSerbianShoshoneSierra LeoneanSiouxSlavicSlovakSloveneSomaliSouth AfricanSouth AmericanSouth American IndianSoviet UnionSpaniardSpanishSpanish AmericanSpanish American IndianSri LankanSubsaharan AfricanSudaneseSwedishSwissSyrianTaiwaneseThaiTlingit-HaidaTohono O'OdhamTonganTrinidadian and TobagonianTsimshianTurkishU.S. Virgin IslanderUgandanUkrainianUruguayanUteVenezuelanVietnameseWelshWest IndianYakamaYaquiYugoslavianYumanYup'ikZimbabwean
Immigration
NonimmigrantsImmigrantsAfghanistanAfricaAlbaniaArgentinaArmeniaAsiaAustraliaAustriaBahamasBangladeshBarbadosBelarusBelgiumBelizeBoliviaBosnia and HerzegovinaBrazilBulgariaBurma/MyanmarCabo VerdeCambodiaCameroonCanadaCaribbeanCentral AmericaChileChinaColombiaCongoCosta RicaCroatiaCubaCzechoslovakiaDenmarkDominicaDominican RepublicEastern AfricaEastern AsiaEastern EuropeEcuadorEgyptEl SalvadorEnglandEritreaEthiopiaEuropeFijiFranceGermanyGhanaGreeceGrenadaGuatemalaGuyanaHaitiHondurasHong KongHungaryIndiaIndonesiaIranIraqIrelandIsraelItalyJamaicaJapanJordanKazakhstanKenyaKoreaKuwaitLaosLatin AmericaLatviaLebanonLiberiaLithuaniaMalaysiaMexicoMicronesiaMiddle AfricaMoldovaMoroccoNepalNetherlandsNicaraguaNigeriaNorth AmericaNorth MacedoniaNorthern AfricaNorthern EuropeNorwayOceaniaPakistanPanamaPeruPhilippinesPolandPortugalRomaniaRussiaSaudi ArabiaScotlandSenegalSerbiaSierra LeoneSingaporeSomaliaSouth AfricaSouth AmericaSouth Central AsiaSouth Eastern AsiaSouthern EuropeSpainSri LankaSt. Vincent and the GrenadinesSudanSwedenSwitzerlandSyriaTaiwanThailandTrinidad and TobagoTurkeyUgandaUkraineUruguayUzbekistanVenezuelaVietnamWest IndiesWestern AfricaWestern AsiaWestern EuropeYemenZaireZimbabweAzores
Puget Sound Salish
Race
Ancestry
AfghanAlaska NativeAlaskan AthabascanAlbanianAleutAlsatianAmericanApacheArabArapahoArgentineanArmenianAssyrian/Chaldean/SyriacAustralianAustrianBahamianBangladeshiBarbadianBasqueBelgianBelizeanBermudanBhutaneseBlackfeetBolivianBrazilianBritishBritish West IndianBulgarianBurmeseCajunCambodianCanadianCape VerdeanCarpatho RusynCelticCentral AmericanCentral American IndianCherokeeCheyenneChickasawChileanChineseChippewaChoctawColombianColvilleComancheCosta RicanCreeCreekCroatianCrowCubanCypriotCzechCzechoslovakianDanishDelawareDominicanDutchDutch West IndianEastern EuropeanEcuadorianEgyptianEnglishEstonianEthiopianEuropeanFijianFilipinoFinnishFrenchFrench American IndianFrench CanadianGermanGerman RussianGhanaianGreekGuamanian/ChamorroGuatemalanGuyaneseHaitianHmongHonduranHopiHoumaHungarianIcelanderIndian (Asian)IndonesianInupiatIranianIraqiIrishIroquoisIsraeliItalianJamaicanJapaneseJordanianKenyanKiowaKoreanLaotianLatvianLebaneseLiberianLithuanianLumbeeLuxembourgerMacedonianMalaysianMalteseMarshalleseMenomineeMexicanMexican American IndianMongolianMoroccanNative HawaiianNavajoNepaleseNew ZealanderNicaraguanNigerianNorthern EuropeanNorwegianOkinawanOsageOttawaPaiutePakistaniPalestinianPanamanianParaguayanPennsylvania GermanPeruvianPimaPolishPortuguesePotawatomiPuebloPuerto RicanPuget Sound SalishRomanianRussianSalvadoranSamoanScandinavianScotch-IrishScottishSeminoleSenegaleseSerbianShoshoneSierra LeoneanSiouxSlavicSlovakSloveneSomaliSouth AfricanSouth AmericanSouth American IndianSoviet UnionSpaniardSpanishSpanish AmericanSpanish American IndianSri LankanSubsaharan AfricanSudaneseSwedishSwissSyrianTaiwaneseThaiTlingit-HaidaTohono O'OdhamTonganTrinidadian and TobagonianTsimshianTurkishU.S. Virgin IslanderUgandanUkrainianUruguayanUteVenezuelanVietnameseWelshWest IndianYakamaYaquiYugoslavianYumanYup'ikZimbabwean
Immigration
NonimmigrantsImmigrantsAfghanistanAfricaAlbaniaArgentinaArmeniaAsiaAustraliaAustriaBahamasBangladeshBarbadosBelarusBelgiumBelizeBoliviaBosnia and HerzegovinaBrazilBulgariaBurma/MyanmarCabo VerdeCambodiaCameroonCanadaCaribbeanCentral AmericaChileChinaColombiaCongoCosta RicaCroatiaCubaCzechoslovakiaDenmarkDominicaDominican RepublicEastern AfricaEastern AsiaEastern EuropeEcuadorEgyptEl SalvadorEnglandEritreaEthiopiaEuropeFijiFranceGermanyGhanaGreeceGrenadaGuatemalaGuyanaHaitiHondurasHong KongHungaryIndiaIndonesiaIranIraqIrelandIsraelItalyJamaicaJapanJordanKazakhstanKenyaKoreaKuwaitLaosLatin AmericaLatviaLebanonLiberiaLithuaniaMalaysiaMexicoMicronesiaMiddle AfricaMoldovaMoroccoNepalNetherlandsNicaraguaNigeriaNorth AmericaNorth MacedoniaNorthern AfricaNorthern EuropeNorwayOceaniaPakistanPanamaPeruPhilippinesPolandPortugalRomaniaRussiaSaudi ArabiaScotlandSenegalSerbiaSierra LeoneSingaporeSomaliaSouth AfricaSouth AmericaSouth Central AsiaSouth Eastern AsiaSouthern EuropeSpainSri LankaSt. Vincent and the GrenadinesSudanSwedenSwitzerlandSyriaTaiwanThailandTrinidad and TobagoTurkeyUgandaUkraineUruguayUzbekistanVenezuelaVietnamWest IndiesWestern AfricaWestern AsiaWestern EuropeYemenZaireZimbabweAzores
2nd Grade
Income
Poverty
Unemployment
Labor Participation
Family Structure
Vehicle Availability
Education Level
Disability

2nd Grade Comparison

Africans

Puget Sound Salish

Poor
Exceptional
97.7%
2ND GRADE
15.6/ 100
METRIC RATING
207th/ 347
METRIC RANK
98.2%
2ND GRADE
98.0/ 100
METRIC RATING
101st/ 347
METRIC RANK

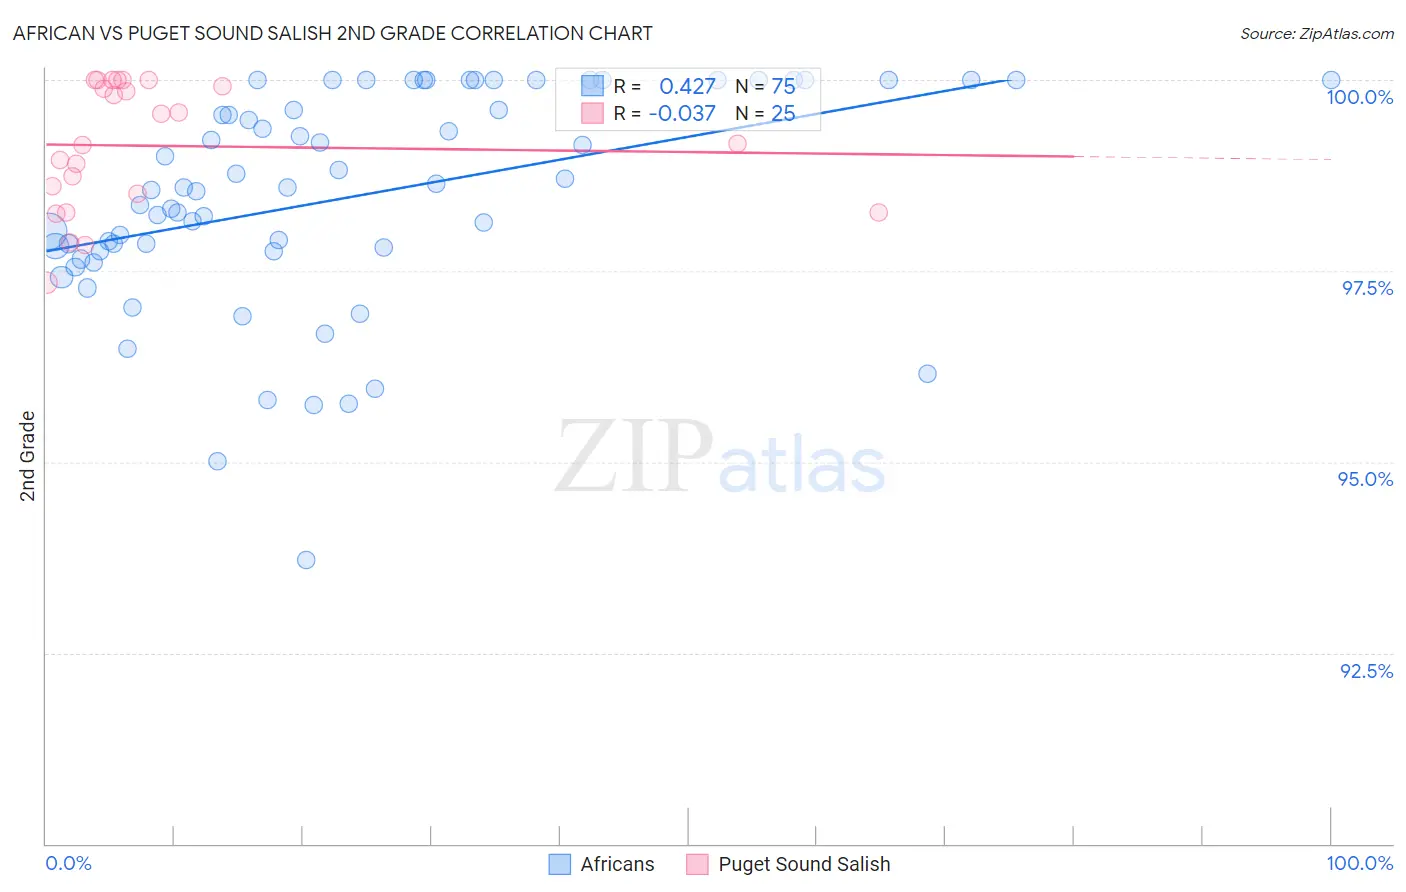
African vs Puget Sound Salish 2nd Grade Correlation Chart

The statistical analysis conducted on geographies consisting of 470,094,148 people shows a moderate positive correlation between the proportion of Africans and percentage of population with at least 2nd grade education in the United States with a correlation coefficient (R) of 0.427 and weighted average of 97.7%. Similarly, the statistical analysis conducted on geographies consisting of 46,155,746 people shows no correlation between the proportion of Puget Sound Salish and percentage of population with at least 2nd grade education in the United States with a correlation coefficient (R) of -0.037 and weighted average of 98.2%, a difference of 0.44%.
African vs Puget Sound Salish 2nd Grade

2nd Grade Correlation Summary

MeasurementAfricanPuget Sound Salish
Minimum93.7%97.3%
Maximum100.0%100.0%
Range6.3%2.7%
Mean98.5%99.1%
Median98.6%99.2%
Interquartile 25% (IQ1)97.8%98.4%
Interquartile 75% (IQ3)100.0%100.0%
Interquartile Range (IQR)2.2%1.6%
Standard Deviation (Sample)1.4%0.83%
Standard Deviation (Population)1.4%0.82%

Similar Demographics by 2nd Grade

Demographics Similar to Africans by 2nd Grade

In terms of 2nd grade, the demographic groups most similar to Africans are Immigrants from Southern Europe (97.8%, a difference of 0.010%), Immigrants from Chile (97.7%, a difference of 0.010%), Yuman (97.8%, a difference of 0.020%), Immigrants from Albania (97.8%, a difference of 0.020%), and Immigrants from Northern Africa (97.7%, a difference of 0.020%).
DemographicsRating | Rank2nd Grade
Immigrants | Lebanon
20.9
/100
|
#200
Fair
97.8%
Tohono O'odham
20.9
/100
|
#201
Fair
97.8%
Immigrants | Ukraine
20.5
/100
|
#202
Fair
97.8%
Yuman
20.0
/100
|
#203
Fair
97.8%
Immigrants | Albania
18.4
/100
|
#204
Poor
97.8%
Immigrants | Southern Europe
18.1
/100
|
#205
Poor
97.8%
Immigrants | Chile
17.3
/100
|
#206
Poor
97.7%
Africans
15.6
/100
|
#207
Poor
97.7%
Immigrants | Northern Africa
12.3
/100
|
#208
Poor
97.7%
Immigrants | Oceania
10.9
/100
|
#209
Poor
97.7%
Costa Ricans
10.5
/100
|
#210
Poor
97.7%
Laotians
9.9
/100
|
#211
Tragic
97.7%
Immigrants | Bahamas
8.4
/100
|
#212
Tragic
97.7%
Moroccans
8.2
/100
|
#213
Tragic
97.7%
Samoans
7.1
/100
|
#214
Tragic
97.7%

Demographics Similar to Puget Sound Salish by 2nd Grade

In terms of 2nd grade, the demographic groups most similar to Puget Sound Salish are Immigrants from Ireland (98.2%, a difference of 0.0%), Romanian (98.2%, a difference of 0.0%), Cree (98.2%, a difference of 0.0%), Choctaw (98.2%, a difference of 0.010%), and Nonimmigrants (98.2%, a difference of 0.010%).
DemographicsRating | Rank2nd Grade
Immigrants | Germany
98.6
/100
|
#94
Exceptional
98.2%
South Africans
98.6
/100
|
#95
Exceptional
98.2%
Cypriots
98.4
/100
|
#96
Exceptional
98.2%
Choctaw
98.3
/100
|
#97
Exceptional
98.2%
Immigrants | Nonimmigrants
98.3
/100
|
#98
Exceptional
98.2%
Immigrants | Ireland
98.0
/100
|
#99
Exceptional
98.2%
Romanians
98.0
/100
|
#100
Exceptional
98.2%
Puget Sound Salish
98.0
/100
|
#101
Exceptional
98.2%
Cree
98.0
/100
|
#102
Exceptional
98.2%
Pima
97.6
/100
|
#103
Exceptional
98.2%
Turks
97.6
/100
|
#104
Exceptional
98.2%
Yugoslavians
97.5
/100
|
#105
Exceptional
98.2%
Bhutanese
97.5
/100
|
#106
Exceptional
98.1%
German Russians
97.4
/100
|
#107
Exceptional
98.1%
Immigrants | Switzerland
97.3
/100
|
#108
Exceptional
98.1%