Zimbabwean vs Immigrants from England Disability Age Over 75

COMPARE

Zimbabwean
Race
Ancestry
AfghanAfricanAlaska NativeAlaskan AthabascanAlbanianAleutAlsatianAmericanApacheArabArapahoArgentineanArmenianAssyrian/Chaldean/SyriacAustralianAustrianBahamianBangladeshiBarbadianBasqueBelgianBelizeanBermudanBhutaneseBlackfeetBolivianBrazilianBritishBritish West IndianBulgarianBurmeseCajunCambodianCanadianCape VerdeanCarpatho RusynCelticCentral AmericanCentral American IndianCherokeeCheyenneChickasawChileanChineseChippewaChoctawColombianColvilleComancheCosta RicanCreeCreekCroatianCrowCubanCypriotCzechCzechoslovakianDanishDelawareDominicanDutchDutch West IndianEastern EuropeanEcuadorianEgyptianEnglishEstonianEthiopianEuropeanFijianFilipinoFinnishFrenchFrench American IndianFrench CanadianGermanGerman RussianGhanaianGreekGuamanian/ChamorroGuatemalanGuyaneseHaitianHmongHonduranHopiHoumaHungarianIcelanderIndian (Asian)IndonesianInupiatIranianIraqiIrishIroquoisIsraeliItalianJamaicanJapaneseJordanianKenyanKiowaKoreanLaotianLatvianLebaneseLiberianLithuanianLumbeeLuxembourgerMacedonianMalaysianMalteseMarshalleseMenomineeMexicanMexican American IndianMongolianMoroccanNative HawaiianNavajoNepaleseNew ZealanderNicaraguanNigerianNorthern EuropeanNorwegianOkinawanOsageOttawaPaiutePakistaniPalestinianPanamanianParaguayanPennsylvania GermanPeruvianPimaPolishPortuguesePotawatomiPuebloPuerto RicanPuget Sound SalishRomanianRussianSalvadoranSamoanScandinavianScotch-IrishScottishSeminoleSenegaleseSerbianShoshoneSierra LeoneanSiouxSlavicSlovakSloveneSomaliSouth AfricanSouth AmericanSouth American IndianSoviet UnionSpaniardSpanishSpanish AmericanSpanish American IndianSri LankanSubsaharan AfricanSudaneseSwedishSwissSyrianTaiwaneseThaiTlingit-HaidaTohono O'OdhamTonganTrinidadian and TobagonianTsimshianTurkishU.S. Virgin IslanderUgandanUkrainianUruguayanUteVenezuelanVietnameseWelshWest IndianYakamaYaquiYugoslavianYumanYup'ikZimbabwean
Immigration
NonimmigrantsImmigrantsAfghanistanAfricaAlbaniaArgentinaArmeniaAsiaAustraliaAustriaBahamasBangladeshBarbadosBelarusBelgiumBelizeBoliviaBosnia and HerzegovinaBrazilBulgariaBurma/MyanmarCabo VerdeCambodiaCameroonCanadaCaribbeanCentral AmericaChileChinaColombiaCongoCosta RicaCroatiaCubaCzechoslovakiaDenmarkDominicaDominican RepublicEastern AfricaEastern AsiaEastern EuropeEcuadorEgyptEl SalvadorEritreaEthiopiaEuropeFijiFranceGermanyGhanaGreeceGrenadaGuatemalaGuyanaHaitiHondurasHong KongHungaryIndiaIndonesiaIranIraqIrelandIsraelItalyJamaicaJapanJordanKazakhstanKenyaKoreaKuwaitLaosLatin AmericaLatviaLebanonLiberiaLithuaniaMalaysiaMexicoMicronesiaMiddle AfricaMoldovaMoroccoNepalNetherlandsNicaraguaNigeriaNorth AmericaNorth MacedoniaNorthern AfricaNorthern EuropeNorwayOceaniaPakistanPanamaPeruPhilippinesPolandPortugalRomaniaRussiaSaudi ArabiaScotlandSenegalSerbiaSierra LeoneSingaporeSomaliaSouth AfricaSouth AmericaSouth Central AsiaSouth Eastern AsiaSouthern EuropeSpainSri LankaSt. Vincent and the GrenadinesSudanSwedenSwitzerlandSyriaTaiwanThailandTrinidad and TobagoTurkeyUgandaUkraineUruguayUzbekistanVenezuelaVietnamWest IndiesWestern AfricaWestern AsiaWestern EuropeYemenZaireZimbabweAzores
Immigrants from England
Race
Ancestry
AfghanAfricanAlaska NativeAlaskan AthabascanAlbanianAleutAlsatianAmericanApacheArabArapahoArgentineanArmenianAssyrian/Chaldean/SyriacAustralianAustrianBahamianBangladeshiBarbadianBasqueBelgianBelizeanBermudanBhutaneseBlackfeetBolivianBrazilianBritishBritish West IndianBulgarianBurmeseCajunCambodianCanadianCape VerdeanCarpatho RusynCelticCentral AmericanCentral American IndianCherokeeCheyenneChickasawChileanChineseChippewaChoctawColombianColvilleComancheCosta RicanCreeCreekCroatianCrowCubanCypriotCzechCzechoslovakianDanishDelawareDominicanDutchDutch West IndianEastern EuropeanEcuadorianEgyptianEnglishEstonianEthiopianEuropeanFijianFilipinoFinnishFrenchFrench American IndianFrench CanadianGermanGerman RussianGhanaianGreekGuamanian/ChamorroGuatemalanGuyaneseHaitianHmongHonduranHopiHoumaHungarianIcelanderIndian (Asian)IndonesianInupiatIranianIraqiIrishIroquoisIsraeliItalianJamaicanJapaneseJordanianKenyanKiowaKoreanLaotianLatvianLebaneseLiberianLithuanianLumbeeLuxembourgerMacedonianMalaysianMalteseMarshalleseMenomineeMexicanMexican American IndianMongolianMoroccanNative HawaiianNavajoNepaleseNew ZealanderNicaraguanNigerianNorthern EuropeanNorwegianOkinawanOsageOttawaPaiutePakistaniPalestinianPanamanianParaguayanPennsylvania GermanPeruvianPimaPolishPortuguesePotawatomiPuebloPuerto RicanPuget Sound SalishRomanianRussianSalvadoranSamoanScandinavianScotch-IrishScottishSeminoleSenegaleseSerbianShoshoneSierra LeoneanSiouxSlavicSlovakSloveneSomaliSouth AfricanSouth AmericanSouth American IndianSoviet UnionSpaniardSpanishSpanish AmericanSpanish American IndianSri LankanSubsaharan AfricanSudaneseSwedishSwissSyrianTaiwaneseThaiTlingit-HaidaTohono O'OdhamTonganTrinidadian and TobagonianTsimshianTurkishU.S. Virgin IslanderUgandanUkrainianUruguayanUteVenezuelanVietnameseWelshWest IndianYakamaYaquiYugoslavianYumanYup'ik
Immigration
NonimmigrantsImmigrantsAfghanistanAfricaAlbaniaArgentinaArmeniaAsiaAustraliaAustriaBahamasBangladeshBarbadosBelarusBelgiumBelizeBoliviaBosnia and HerzegovinaBrazilBulgariaBurma/MyanmarCabo VerdeCambodiaCameroonCanadaCaribbeanCentral AmericaChileChinaColombiaCongoCosta RicaCroatiaCubaCzechoslovakiaDenmarkDominicaDominican RepublicEastern AfricaEastern AsiaEastern EuropeEcuadorEgyptEl SalvadorEnglandEritreaEthiopiaEuropeFijiFranceGermanyGhanaGreeceGrenadaGuatemalaGuyanaHaitiHondurasHong KongHungaryIndiaIndonesiaIranIraqIrelandIsraelItalyJamaicaJapanJordanKazakhstanKenyaKoreaKuwaitLaosLatin AmericaLatviaLebanonLiberiaLithuaniaMalaysiaMexicoMicronesiaMiddle AfricaMoldovaMoroccoNepalNetherlandsNicaraguaNigeriaNorth AmericaNorth MacedoniaNorthern AfricaNorthern EuropeNorwayOceaniaPakistanPanamaPeruPhilippinesPolandPortugalRomaniaRussiaSaudi ArabiaScotlandSenegalSerbiaSierra LeoneSingaporeSomaliaSouth AfricaSouth AmericaSouth Central AsiaSouth Eastern AsiaSouthern EuropeSpainSri LankaSt. Vincent and the GrenadinesSudanSwedenSwitzerlandSyriaTaiwanThailandTrinidad and TobagoTurkeyUgandaUkraineUruguayUzbekistanVenezuelaVietnamWest IndiesWestern AfricaWestern AsiaWestern EuropeYemenZaireZimbabweAzores
Disability Age Over 75
Income
Poverty
Unemployment
Labor Participation
Family Structure
Vehicle Availability
Education Level
Disability

Disability Age Over 75 Comparison

Zimbabweans

Immigrants from England

Tragic
Exceptional
48.1%
DISABILITY AGE OVER 75
6.4/ 100
METRIC RATING
227th/ 347
METRIC RANK
46.0%
DISABILITY AGE OVER 75
99.5/ 100
METRIC RATING
66th/ 347
METRIC RANK

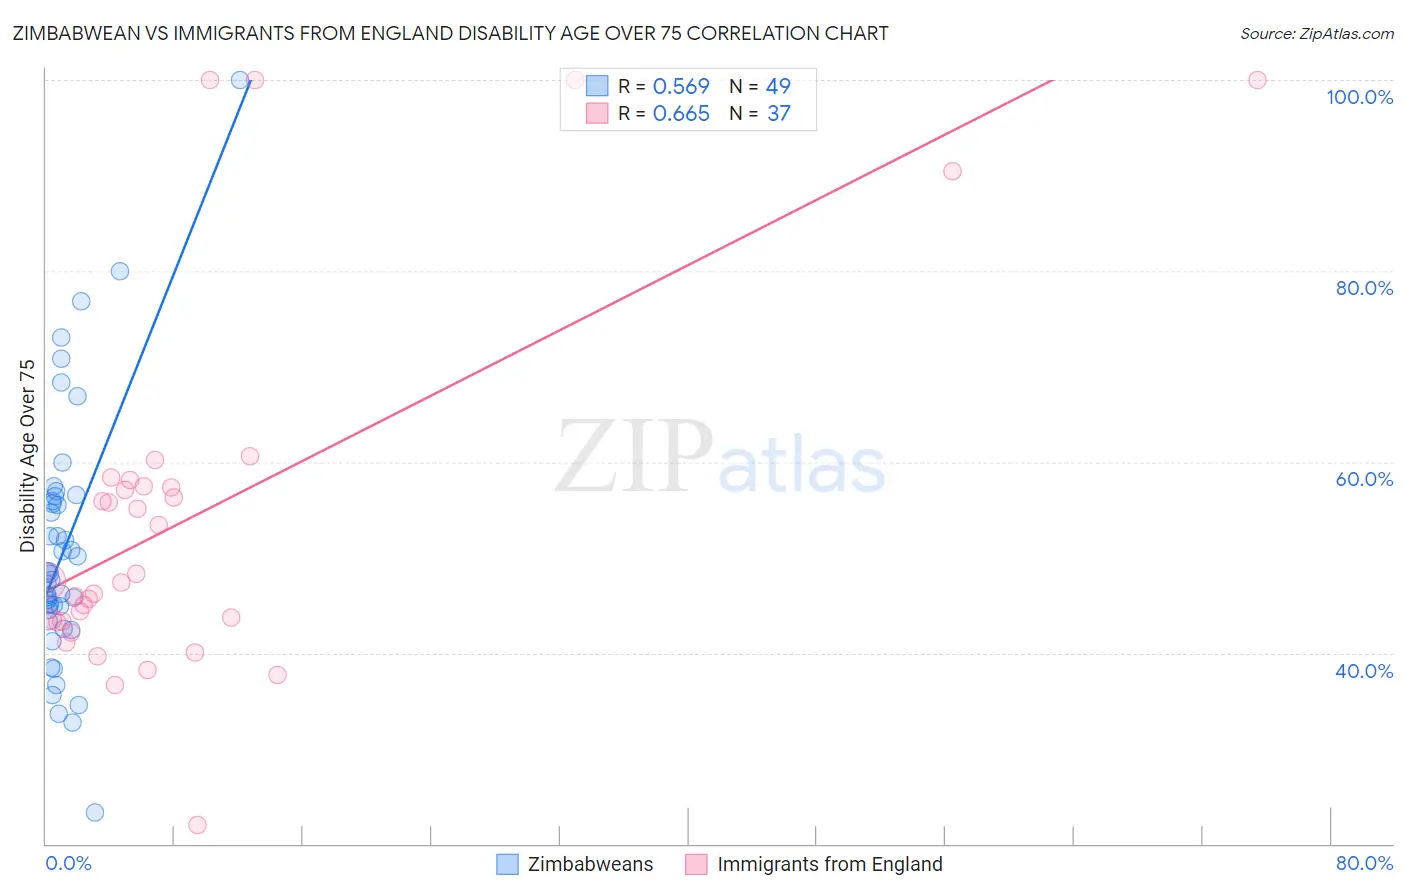
Zimbabwean vs Immigrants from England Disability Age Over 75 Correlation Chart

The statistical analysis conducted on geographies consisting of 69,112,406 people shows a substantial positive correlation between the proportion of Zimbabweans and percentage of population with a disability over the age of 75 in the United States with a correlation coefficient (R) of 0.569 and weighted average of 48.1%. Similarly, the statistical analysis conducted on geographies consisting of 391,479,678 people shows a significant positive correlation between the proportion of Immigrants from England and percentage of population with a disability over the age of 75 in the United States with a correlation coefficient (R) of 0.665 and weighted average of 46.0%, a difference of 4.6%.
Zimbabwean vs Immigrants from England Disability Age Over 75

Disability Age Over 75 Correlation Summary

MeasurementZimbabweanImmigrants from England
Minimum23.2%21.9%
Maximum100.0%100.0%
Range76.8%78.1%
Mean50.8%54.5%
Median48.2%47.5%
Interquartile 25% (IQ1)43.9%43.3%
Interquartile 75% (IQ3)56.1%57.8%
Interquartile Range (IQR)12.3%14.5%
Standard Deviation (Sample)13.5%19.3%
Standard Deviation (Population)13.4%19.1%

Similar Demographics by Disability Age Over 75

Demographics Similar to Zimbabweans by Disability Age Over 75

In terms of disability age over 75, the demographic groups most similar to Zimbabweans are Spanish (48.0%, a difference of 0.010%), Nonimmigrants (48.0%, a difference of 0.010%), Liberian (48.0%, a difference of 0.020%), Immigrants from Bangladesh (48.0%, a difference of 0.030%), and Barbadian (48.0%, a difference of 0.040%).
DemographicsRating | RankDisability Age Over 75
Bahamians
7.4
/100
|
#220
Tragic
48.0%
Immigrants | Oceania
7.3
/100
|
#221
Tragic
48.0%
Barbadians
6.8
/100
|
#222
Tragic
48.0%
Immigrants | Bangladesh
6.8
/100
|
#223
Tragic
48.0%
Liberians
6.7
/100
|
#224
Tragic
48.0%
Spanish
6.5
/100
|
#225
Tragic
48.0%
Immigrants | Nonimmigrants
6.5
/100
|
#226
Tragic
48.0%
Zimbabweans
6.4
/100
|
#227
Tragic
48.1%
Immigrants | Liberia
5.9
/100
|
#228
Tragic
48.1%
Spaniards
5.7
/100
|
#229
Tragic
48.1%
Taiwanese
4.4
/100
|
#230
Tragic
48.2%
Immigrants | Immigrants
4.3
/100
|
#231
Tragic
48.2%
Indonesians
4.2
/100
|
#232
Tragic
48.2%
Cree
4.2
/100
|
#233
Tragic
48.2%
Sub-Saharan Africans
3.8
/100
|
#234
Tragic
48.2%

Demographics Similar to Immigrants from England by Disability Age Over 75

In terms of disability age over 75, the demographic groups most similar to Immigrants from England are Austrian (46.0%, a difference of 0.010%), Immigrants from Spain (46.0%, a difference of 0.030%), Immigrants from North Macedonia (45.9%, a difference of 0.040%), Immigrants from Norway (45.9%, a difference of 0.050%), and Immigrants from South Central Asia (46.0%, a difference of 0.070%).
DemographicsRating | RankDisability Age Over 75
Iranians
99.6
/100
|
#59
Exceptional
45.9%
Immigrants | Europe
99.6
/100
|
#60
Exceptional
45.9%
Immigrants | Argentina
99.6
/100
|
#61
Exceptional
45.9%
Burmese
99.5
/100
|
#62
Exceptional
45.9%
Immigrants | Norway
99.5
/100
|
#63
Exceptional
45.9%
Immigrants | North Macedonia
99.5
/100
|
#64
Exceptional
45.9%
Austrians
99.5
/100
|
#65
Exceptional
46.0%
Immigrants | England
99.5
/100
|
#66
Exceptional
46.0%
Immigrants | Spain
99.4
/100
|
#67
Exceptional
46.0%
Immigrants | South Central Asia
99.4
/100
|
#68
Exceptional
46.0%
Immigrants | Romania
99.3
/100
|
#69
Exceptional
46.0%
Jordanians
99.2
/100
|
#70
Exceptional
46.1%
Immigrants | Sri Lanka
99.2
/100
|
#71
Exceptional
46.1%
Immigrants | Hungary
99.1
/100
|
#72
Exceptional
46.1%
Cambodians
99.1
/100
|
#73
Exceptional
46.1%