Yugoslavian vs Immigrants from Ghana Cognitive Disability

COMPARE

Yugoslavian
Race
Ancestry
AfghanAfricanAlaska NativeAlaskan AthabascanAlbanianAleutAlsatianAmericanApacheArabArapahoArgentineanArmenianAssyrian/Chaldean/SyriacAustralianAustrianBahamianBangladeshiBarbadianBasqueBelgianBelizeanBermudanBhutaneseBlackfeetBolivianBrazilianBritishBritish West IndianBulgarianBurmeseCajunCambodianCanadianCape VerdeanCarpatho RusynCelticCentral AmericanCentral American IndianCherokeeCheyenneChickasawChileanChineseChippewaChoctawColombianColvilleComancheCosta RicanCreeCreekCroatianCrowCubanCypriotCzechCzechoslovakianDanishDelawareDominicanDutchDutch West IndianEastern EuropeanEcuadorianEgyptianEnglishEstonianEthiopianEuropeanFijianFilipinoFinnishFrenchFrench American IndianFrench CanadianGermanGerman RussianGhanaianGreekGuamanian/ChamorroGuatemalanGuyaneseHaitianHmongHonduranHopiHoumaHungarianIcelanderIndian (Asian)IndonesianInupiatIranianIraqiIrishIroquoisIsraeliItalianJamaicanJapaneseJordanianKenyanKiowaKoreanLaotianLatvianLebaneseLiberianLithuanianLumbeeLuxembourgerMacedonianMalaysianMalteseMarshalleseMenomineeMexicanMexican American IndianMongolianMoroccanNative HawaiianNavajoNepaleseNew ZealanderNicaraguanNigerianNorthern EuropeanNorwegianOkinawanOsageOttawaPaiutePakistaniPalestinianPanamanianParaguayanPennsylvania GermanPeruvianPimaPolishPortuguesePotawatomiPuebloPuerto RicanPuget Sound SalishRomanianRussianSalvadoranSamoanScandinavianScotch-IrishScottishSeminoleSenegaleseSerbianShoshoneSierra LeoneanSiouxSlavicSlovakSloveneSomaliSouth AfricanSouth AmericanSouth American IndianSoviet UnionSpaniardSpanishSpanish AmericanSpanish American IndianSri LankanSubsaharan AfricanSudaneseSwedishSwissSyrianTaiwaneseThaiTlingit-HaidaTohono O'OdhamTonganTrinidadian and TobagonianTsimshianTurkishU.S. Virgin IslanderUgandanUkrainianUruguayanUteVenezuelanVietnameseWelshWest IndianYakamaYaquiYugoslavianYumanYup'ikZimbabwean
Immigration
NonimmigrantsImmigrantsAfghanistanAfricaAlbaniaArgentinaArmeniaAsiaAustraliaAustriaBahamasBangladeshBarbadosBelarusBelgiumBelizeBoliviaBosnia and HerzegovinaBrazilBulgariaBurma/MyanmarCabo VerdeCambodiaCameroonCanadaCaribbeanCentral AmericaChileChinaColombiaCongoCosta RicaCroatiaCubaCzechoslovakiaDenmarkDominicaDominican RepublicEastern AfricaEastern AsiaEastern EuropeEcuadorEgyptEl SalvadorEnglandEritreaEthiopiaEuropeFijiFranceGermanyGreeceGrenadaGuatemalaGuyanaHaitiHondurasHong KongHungaryIndiaIndonesiaIranIraqIrelandIsraelItalyJamaicaJapanJordanKazakhstanKenyaKoreaKuwaitLaosLatin AmericaLatviaLebanonLiberiaLithuaniaMalaysiaMexicoMicronesiaMiddle AfricaMoldovaMoroccoNepalNetherlandsNicaraguaNigeriaNorth AmericaNorth MacedoniaNorthern AfricaNorthern EuropeNorwayOceaniaPakistanPanamaPeruPhilippinesPolandPortugalRomaniaRussiaSaudi ArabiaScotlandSenegalSerbiaSierra LeoneSingaporeSomaliaSouth AfricaSouth AmericaSouth Central AsiaSouth Eastern AsiaSouthern EuropeSpainSri LankaSt. Vincent and the GrenadinesSudanSwedenSwitzerlandSyriaTaiwanThailandTrinidad and TobagoTurkeyUgandaUkraineUruguayUzbekistanVenezuelaVietnamWest IndiesWestern AfricaWestern AsiaWestern EuropeYemenZaireZimbabweAzores
Immigrants from Ghana
Race
Ancestry
AfghanAfricanAlaska NativeAlaskan AthabascanAlbanianAleutAlsatianAmericanApacheArabArapahoArgentineanArmenianAssyrian/Chaldean/SyriacAustralianAustrianBahamianBangladeshiBarbadianBasqueBelgianBelizeanBermudanBhutaneseBlackfeetBolivianBrazilianBritishBritish West IndianBulgarianBurmeseCajunCambodianCanadianCape VerdeanCarpatho RusynCelticCentral AmericanCentral American IndianCherokeeCheyenneChickasawChileanChineseChippewaChoctawColombianColvilleComancheCosta RicanCreeCreekCroatianCrowCubanCypriotCzechCzechoslovakianDanishDelawareDominicanDutchDutch West IndianEastern EuropeanEcuadorianEgyptianEnglishEstonianEthiopianEuropeanFijianFilipinoFinnishFrenchFrench American IndianFrench CanadianGermanGerman RussianGhanaianGreekGuamanian/ChamorroGuatemalanGuyaneseHaitianHmongHonduranHopiHoumaHungarianIcelanderIndian (Asian)IndonesianInupiatIranianIraqiIrishIroquoisIsraeliItalianJamaicanJapaneseJordanianKenyanKiowaKoreanLaotianLatvianLebaneseLiberianLithuanianLumbeeLuxembourgerMacedonianMalaysianMalteseMarshalleseMenomineeMexicanMexican American IndianMongolianMoroccanNative HawaiianNavajoNepaleseNew ZealanderNicaraguanNigerianNorthern EuropeanNorwegianOkinawanOsageOttawaPaiutePakistaniPalestinianPanamanianParaguayanPennsylvania GermanPeruvianPimaPolishPortuguesePotawatomiPuebloPuerto RicanPuget Sound SalishRomanianRussianSalvadoranSamoanScandinavianScotch-IrishScottishSeminoleSenegaleseSerbianShoshoneSierra LeoneanSiouxSlavicSlovakSloveneSomaliSouth AfricanSouth AmericanSouth American IndianSoviet UnionSpaniardSpanishSpanish AmericanSpanish American IndianSri LankanSubsaharan AfricanSudaneseSwedishSwissSyrianTaiwaneseThaiTlingit-HaidaTohono O'OdhamTonganTrinidadian and TobagonianTsimshianTurkishU.S. Virgin IslanderUgandanUkrainianUruguayanUteVenezuelanVietnameseWelshWest IndianYakamaYaquiYumanYup'ikZimbabwean
Immigration
NonimmigrantsImmigrantsAfghanistanAfricaAlbaniaArgentinaArmeniaAsiaAustraliaAustriaBahamasBangladeshBarbadosBelarusBelgiumBelizeBoliviaBosnia and HerzegovinaBrazilBulgariaBurma/MyanmarCabo VerdeCambodiaCameroonCanadaCaribbeanCentral AmericaChileChinaColombiaCongoCosta RicaCroatiaCubaCzechoslovakiaDenmarkDominicaDominican RepublicEastern AfricaEastern AsiaEastern EuropeEcuadorEgyptEl SalvadorEnglandEritreaEthiopiaEuropeFijiFranceGermanyGhanaGreeceGrenadaGuatemalaGuyanaHaitiHondurasHong KongHungaryIndiaIndonesiaIranIraqIrelandIsraelItalyJamaicaJapanJordanKazakhstanKenyaKoreaKuwaitLaosLatin AmericaLatviaLebanonLiberiaLithuaniaMalaysiaMexicoMicronesiaMiddle AfricaMoldovaMoroccoNepalNetherlandsNicaraguaNigeriaNorth AmericaNorth MacedoniaNorthern AfricaNorthern EuropeNorwayOceaniaPakistanPanamaPeruPhilippinesPolandPortugalRomaniaRussiaSaudi ArabiaScotlandSenegalSerbiaSierra LeoneSingaporeSomaliaSouth AfricaSouth AmericaSouth Central AsiaSouth Eastern AsiaSouthern EuropeSpainSri LankaSt. Vincent and the GrenadinesSudanSwedenSwitzerlandSyriaTaiwanThailandTrinidad and TobagoTurkeyUgandaUkraineUruguayUzbekistanVenezuelaVietnamWest IndiesWestern AfricaWestern AsiaWestern EuropeYemenZaireZimbabweAzores
Cognitive Disability
Income
Poverty
Unemployment
Labor Participation
Family Structure
Vehicle Availability
Education Level
Disability

Cognitive Disability Comparison

Yugoslavians

Immigrants from Ghana

Good
Tragic
17.2%
COGNITIVE DISABILITY
71.6/ 100
METRIC RATING
162nd/ 347
METRIC RANK
18.3%
COGNITIVE DISABILITY
0.0/ 100
METRIC RATING
301st/ 347
METRIC RANK

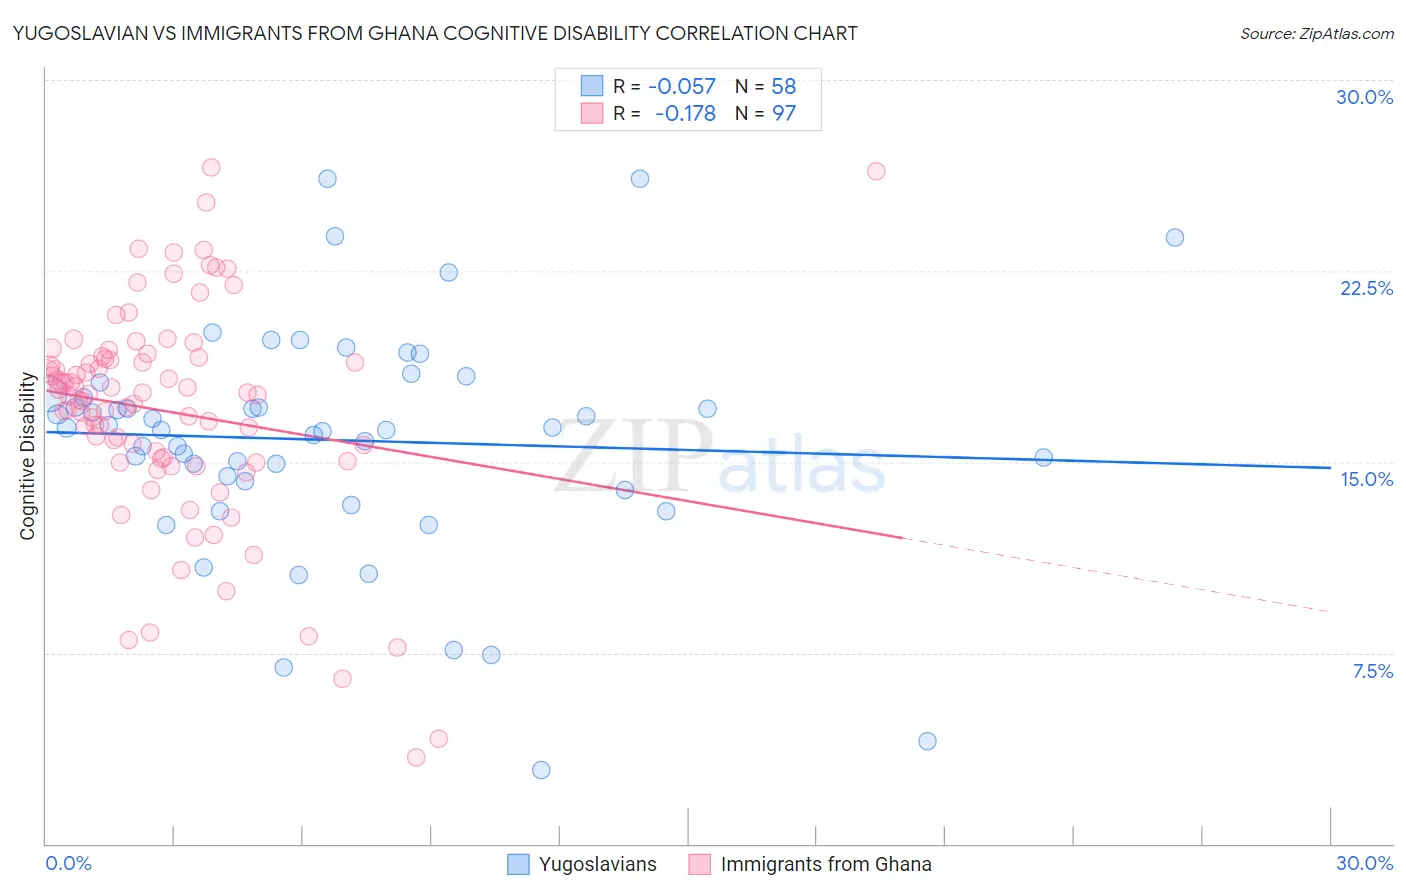
Yugoslavian vs Immigrants from Ghana Cognitive Disability Correlation Chart

The statistical analysis conducted on geographies consisting of 285,698,583 people shows a slight negative correlation between the proportion of Yugoslavians and percentage of population with cognitive disability in the United States with a correlation coefficient (R) of -0.057 and weighted average of 17.2%. Similarly, the statistical analysis conducted on geographies consisting of 199,902,948 people shows a poor negative correlation between the proportion of Immigrants from Ghana and percentage of population with cognitive disability in the United States with a correlation coefficient (R) of -0.178 and weighted average of 18.3%, a difference of 6.6%.
Yugoslavian vs Immigrants from Ghana Cognitive Disability

Cognitive Disability Correlation Summary

MeasurementYugoslavianImmigrants from Ghana
Minimum2.9%3.4%
Maximum26.1%26.6%
Range23.2%23.2%
Mean15.9%17.0%
Median16.3%17.6%
Interquartile 25% (IQ1)14.3%15.1%
Interquartile 75% (IQ3)17.7%19.1%
Interquartile Range (IQR)3.4%4.0%
Standard Deviation (Sample)4.5%4.3%
Standard Deviation (Population)4.5%4.3%

Similar Demographics by Cognitive Disability

Demographics Similar to Yugoslavians by Cognitive Disability

In terms of cognitive disability, the demographic groups most similar to Yugoslavians are Immigrants from Switzerland (17.2%, a difference of 0.0%), American (17.2%, a difference of 0.020%), Australian (17.2%, a difference of 0.030%), Armenian (17.2%, a difference of 0.050%), and Immigrants from Latvia (17.2%, a difference of 0.060%).
DemographicsRating | RankCognitive Disability
Brazilians
78.9
/100
|
#155
Good
17.1%
Sri Lankans
78.9
/100
|
#156
Good
17.1%
Immigrants | Australia
76.0
/100
|
#157
Good
17.1%
Celtics
74.1
/100
|
#158
Good
17.1%
Immigrants | Latvia
73.2
/100
|
#159
Good
17.2%
Australians
72.4
/100
|
#160
Good
17.2%
Americans
72.2
/100
|
#161
Good
17.2%
Yugoslavians
71.6
/100
|
#162
Good
17.2%
Immigrants | Switzerland
71.5
/100
|
#163
Good
17.2%
Armenians
70.1
/100
|
#164
Good
17.2%
Immigrants | Albania
64.9
/100
|
#165
Good
17.2%
Immigrants | Ecuador
64.4
/100
|
#166
Good
17.2%
Immigrants | Syria
63.5
/100
|
#167
Good
17.2%
Immigrants | Immigrants
62.5
/100
|
#168
Good
17.2%
Immigrants | Portugal
61.8
/100
|
#169
Good
17.2%

Demographics Similar to Immigrants from Ghana by Cognitive Disability

In terms of cognitive disability, the demographic groups most similar to Immigrants from Ghana are Barbadian (18.3%, a difference of 0.080%), Immigrants from Kenya (18.3%, a difference of 0.090%), Creek (18.3%, a difference of 0.14%), Immigrants from Eritrea (18.3%, a difference of 0.15%), and Ghanaian (18.3%, a difference of 0.17%).
DemographicsRating | RankCognitive Disability
British West Indians
0.1
/100
|
#294
Tragic
18.2%
German Russians
0.0
/100
|
#295
Tragic
18.2%
Immigrants | Burma/Myanmar
0.0
/100
|
#296
Tragic
18.2%
Blackfeet
0.0
/100
|
#297
Tragic
18.3%
Japanese
0.0
/100
|
#298
Tragic
18.3%
Ghanaians
0.0
/100
|
#299
Tragic
18.3%
Creek
0.0
/100
|
#300
Tragic
18.3%
Immigrants | Ghana
0.0
/100
|
#301
Tragic
18.3%
Barbadians
0.0
/100
|
#302
Tragic
18.3%
Immigrants | Kenya
0.0
/100
|
#303
Tragic
18.3%
Immigrants | Eritrea
0.0
/100
|
#304
Tragic
18.3%
Colville
0.0
/100
|
#305
Tragic
18.3%
Seminole
0.0
/100
|
#306
Tragic
18.3%
Ugandans
0.0
/100
|
#307
Tragic
18.3%
Immigrants | Western Africa
0.0
/100
|
#308
Tragic
18.4%