Yakama vs Iraqi Disability Age Over 75
COMPARE
Yakama
Iraqi
Disability Age Over 75
Disability Age Over 75 Comparison
Yakama
Iraqis
51.3%
DISABILITY AGE OVER 75
0.0/ 100
METRIC RATING
317th/ 347
METRIC RANK
48.6%
DISABILITY AGE OVER 75
1.0/ 100
METRIC RATING
249th/ 347
METRIC RANK
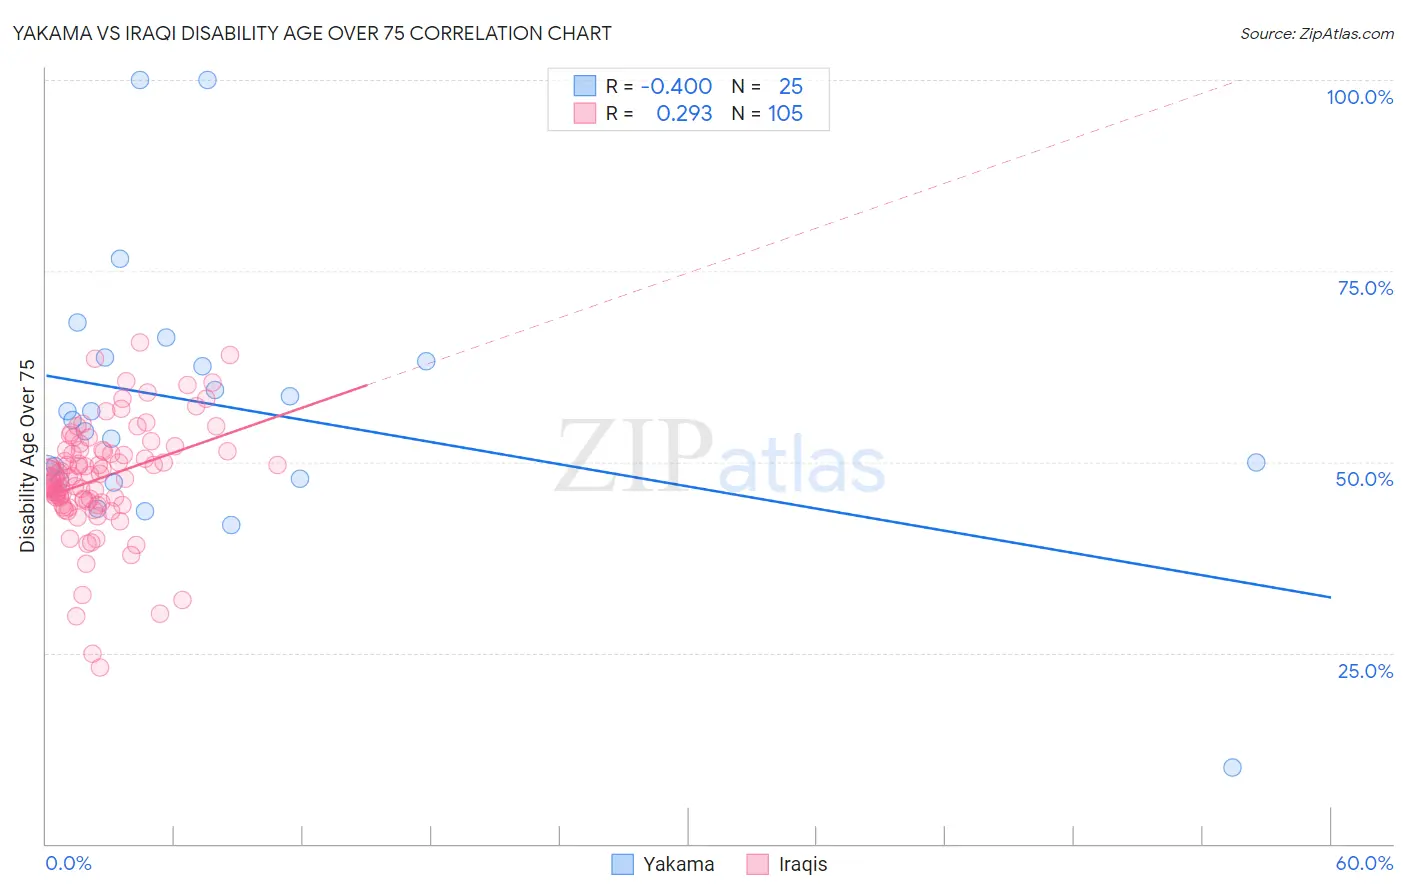
Yakama vs Iraqi Disability Age Over 75 Correlation Chart
The statistical analysis conducted on geographies consisting of 19,911,140 people shows a moderate negative correlation between the proportion of Yakama and percentage of population with a disability over the age of 75 in the United States with a correlation coefficient (R) of -0.400 and weighted average of 51.3%. Similarly, the statistical analysis conducted on geographies consisting of 170,579,857 people shows a weak positive correlation between the proportion of Iraqis and percentage of population with a disability over the age of 75 in the United States with a correlation coefficient (R) of 0.293 and weighted average of 48.6%, a difference of 5.6%.
Disability Age Over 75 Correlation Summary
| Measurement | Yakama | Iraqi |
| Minimum | 10.0% | 23.1% |
| Maximum | 100.0% | 65.6% |
| Range | 90.0% | 42.5% |
| Mean | 57.0% | 47.8% |
| Median | 55.5% | 48.0% |
| Interquartile 25% (IQ1) | 47.8% | 44.8% |
| Interquartile 75% (IQ3) | 63.4% | 51.5% |
| Interquartile Range (IQR) | 15.6% | 6.8% |
| Standard Deviation (Sample) | 17.9% | 7.3% |
| Standard Deviation (Population) | 17.5% | 7.3% |
Similar Demographics by Disability Age Over 75
Demographics Similar to Yakama by Disability Age Over 75
In terms of disability age over 75, the demographic groups most similar to Yakama are Chickasaw (51.2%, a difference of 0.18%), Mexican (51.1%, a difference of 0.32%), Seminole (51.5%, a difference of 0.33%), Creek (51.5%, a difference of 0.33%), and Immigrants from Mexico (51.1%, a difference of 0.37%).
| Demographics | Rating | Rank | Disability Age Over 75 |
| Tlingit-Haida | 0.0 /100 | #310 | Tragic 50.6% |
| Cajuns | 0.0 /100 | #311 | Tragic 50.7% |
| Cheyenne | 0.0 /100 | #312 | Tragic 50.9% |
| Immigrants | Azores | 0.0 /100 | #313 | Tragic 50.9% |
| Immigrants | Mexico | 0.0 /100 | #314 | Tragic 51.1% |
| Mexicans | 0.0 /100 | #315 | Tragic 51.1% |
| Chickasaw | 0.0 /100 | #316 | Tragic 51.2% |
| Yakama | 0.0 /100 | #317 | Tragic 51.3% |
| Seminole | 0.0 /100 | #318 | Tragic 51.5% |
| Creek | 0.0 /100 | #319 | Tragic 51.5% |
| Paiute | 0.0 /100 | #320 | Tragic 51.5% |
| Dutch West Indians | 0.0 /100 | #321 | Tragic 51.5% |
| Comanche | 0.0 /100 | #322 | Tragic 51.7% |
| Immigrants | Yemen | 0.0 /100 | #323 | Tragic 52.0% |
| Menominee | 0.0 /100 | #324 | Tragic 52.3% |
Demographics Similar to Iraqis by Disability Age Over 75
In terms of disability age over 75, the demographic groups most similar to Iraqis are West Indian (48.6%, a difference of 0.080%), Korean (48.6%, a difference of 0.10%), Immigrants from South Eastern Asia (48.7%, a difference of 0.20%), Sri Lankan (48.5%, a difference of 0.21%), and British West Indian (48.7%, a difference of 0.25%).
| Demographics | Rating | Rank | Disability Age Over 75 |
| French American Indians | 2.2 /100 | #242 | Tragic 48.3% |
| Immigrants | Caribbean | 2.1 /100 | #243 | Tragic 48.4% |
| Afghans | 1.8 /100 | #244 | Tragic 48.4% |
| Americans | 1.7 /100 | #245 | Tragic 48.4% |
| Chippewa | 1.6 /100 | #246 | Tragic 48.4% |
| Iroquois | 1.6 /100 | #247 | Tragic 48.4% |
| Sri Lankans | 1.4 /100 | #248 | Tragic 48.5% |
| Iraqis | 1.0 /100 | #249 | Tragic 48.6% |
| West Indians | 0.8 /100 | #250 | Tragic 48.6% |
| Koreans | 0.8 /100 | #251 | Tragic 48.6% |
| Immigrants | South Eastern Asia | 0.7 /100 | #252 | Tragic 48.7% |
| British West Indians | 0.6 /100 | #253 | Tragic 48.7% |
| Immigrants | Vietnam | 0.6 /100 | #254 | Tragic 48.7% |
| Chinese | 0.5 /100 | #255 | Tragic 48.7% |
| Immigrants | Congo | 0.5 /100 | #256 | Tragic 48.7% |