Turkish vs Cypriot Disability Age 18 to 34

COMPARE

Turkish
Race
Ancestry
AfghanAfricanAlaska NativeAlaskan AthabascanAlbanianAleutAlsatianAmericanApacheArabArapahoArgentineanArmenianAssyrian/Chaldean/SyriacAustralianAustrianBahamianBangladeshiBarbadianBasqueBelgianBelizeanBermudanBhutaneseBlackfeetBolivianBrazilianBritishBritish West IndianBulgarianBurmeseCajunCambodianCanadianCape VerdeanCarpatho RusynCelticCentral AmericanCentral American IndianCherokeeCheyenneChickasawChileanChineseChippewaChoctawColombianColvilleComancheCosta RicanCreeCreekCroatianCrowCubanCzechCzechoslovakianDanishDelawareDominicanDutchDutch West IndianEastern EuropeanEcuadorianEgyptianEnglishEstonianEthiopianEuropeanFijianFilipinoFinnishFrenchFrench American IndianFrench CanadianGermanGerman RussianGhanaianGreekGuamanian/ChamorroGuatemalanGuyaneseHaitianHmongHonduranHopiHoumaHungarianIcelanderIndian (Asian)IndonesianInupiatIranianIraqiIrishIroquoisIsraeliItalianJamaicanJapaneseJordanianKenyanKiowaKoreanLaotianLatvianLebaneseLiberianLithuanianLumbeeLuxembourgerMacedonianMalaysianMalteseMarshalleseMenomineeMexicanMexican American IndianMongolianMoroccanNative HawaiianNavajoNepaleseNew ZealanderNicaraguanNigerianNorthern EuropeanNorwegianOkinawanOsageOttawaPaiutePakistaniPalestinianPanamanianParaguayanPennsylvania GermanPeruvianPimaPolishPortuguesePotawatomiPuebloPuerto RicanPuget Sound SalishRomanianRussianSalvadoranSamoanScandinavianScotch-IrishScottishSeminoleSenegaleseSerbianShoshoneSierra LeoneanSiouxSlavicSlovakSloveneSomaliSouth AfricanSouth AmericanSouth American IndianSoviet UnionSpaniardSpanishSpanish AmericanSpanish American IndianSri LankanSubsaharan AfricanSudaneseSwedishSwissSyrianTaiwaneseThaiTlingit-HaidaTohono O'OdhamTonganTrinidadian and TobagonianTsimshianTurkishU.S. Virgin IslanderUgandanUkrainianUruguayanUteVenezuelanVietnameseWelshWest IndianYakamaYaquiYugoslavianYumanYup'ikZimbabwean
Immigration
NonimmigrantsImmigrantsAfghanistanAfricaAlbaniaArgentinaArmeniaAsiaAustraliaAustriaBahamasBangladeshBarbadosBelarusBelgiumBelizeBoliviaBosnia and HerzegovinaBrazilBulgariaBurma/MyanmarCabo VerdeCambodiaCameroonCanadaCaribbeanCentral AmericaChileChinaColombiaCongoCosta RicaCroatiaCubaCzechoslovakiaDenmarkDominicaDominican RepublicEastern AfricaEastern AsiaEastern EuropeEcuadorEgyptEl SalvadorEnglandEritreaEthiopiaEuropeFijiFranceGermanyGhanaGreeceGrenadaGuatemalaGuyanaHaitiHondurasHong KongHungaryIndiaIndonesiaIranIraqIrelandIsraelItalyJamaicaJapanJordanKazakhstanKenyaKoreaKuwaitLaosLatin AmericaLatviaLebanonLiberiaLithuaniaMalaysiaMexicoMicronesiaMiddle AfricaMoldovaMoroccoNepalNetherlandsNicaraguaNigeriaNorth AmericaNorth MacedoniaNorthern AfricaNorthern EuropeNorwayOceaniaPakistanPanamaPeruPhilippinesPolandPortugalRomaniaRussiaSaudi ArabiaScotlandSenegalSerbiaSierra LeoneSingaporeSomaliaSouth AfricaSouth AmericaSouth Central AsiaSouth Eastern AsiaSouthern EuropeSpainSri LankaSt. Vincent and the GrenadinesSudanSwedenSwitzerlandSyriaTaiwanThailandTrinidad and TobagoTurkeyUgandaUkraineUruguayUzbekistanVenezuelaVietnamWest IndiesWestern AfricaWestern AsiaWestern EuropeYemenZaireZimbabweAzores
Cypriot
Race
Ancestry
AfghanAfricanAlaska NativeAlaskan AthabascanAlbanianAleutAlsatianAmericanApacheArabArapahoArgentineanArmenianAssyrian/Chaldean/SyriacAustralianAustrianBahamianBangladeshiBarbadianBasqueBelgianBelizeanBermudanBhutaneseBlackfeetBolivianBrazilianBritishBritish West IndianBulgarianBurmeseCajunCambodianCanadianCape VerdeanCarpatho RusynCelticCentral AmericanCentral American IndianCherokeeCheyenneChickasawChileanChineseChippewaChoctawColombianColvilleComancheCosta RicanCreeCreekCroatianCrowCubanCypriotCzechCzechoslovakianDanishDelawareDominicanDutchDutch West IndianEastern EuropeanEcuadorianEgyptianEnglishEstonianEthiopianEuropeanFijianFilipinoFinnishFrenchFrench American IndianFrench CanadianGermanGerman RussianGhanaianGreekGuamanian/ChamorroGuatemalanGuyaneseHaitianHmongHonduranHopiHoumaHungarianIcelanderIndian (Asian)IndonesianInupiatIranianIraqiIrishIroquoisIsraeliItalianJamaicanJapaneseJordanianKenyanKiowaKoreanLaotianLatvianLebaneseLiberianLithuanianLumbeeLuxembourgerMacedonianMalaysianMalteseMarshalleseMenomineeMexicanMexican American IndianMongolianMoroccanNative HawaiianNavajoNepaleseNew ZealanderNicaraguanNigerianNorthern EuropeanNorwegianOkinawanOsageOttawaPaiutePakistaniPalestinianPanamanianParaguayanPennsylvania GermanPeruvianPimaPolishPortuguesePotawatomiPuebloPuerto RicanPuget Sound SalishRomanianRussianSalvadoranSamoanScandinavianScotch-IrishScottishSeminoleSenegaleseSerbianShoshoneSierra LeoneanSiouxSlavicSlovakSloveneSomaliSouth AfricanSouth AmericanSouth American IndianSoviet UnionSpaniardSpanishSpanish AmericanSpanish American IndianSri LankanSubsaharan AfricanSudaneseSwedishSwissSyrianTaiwaneseThaiTlingit-HaidaTohono O'OdhamTonganTrinidadian and TobagonianTsimshianU.S. Virgin IslanderUgandanUkrainianUruguayanUteVenezuelanVietnameseWelshWest IndianYakamaYaquiYugoslavianYumanYup'ikZimbabwean
Immigration
NonimmigrantsImmigrantsAfghanistanAfricaAlbaniaArgentinaArmeniaAsiaAustraliaAustriaBahamasBangladeshBarbadosBelarusBelgiumBelizeBoliviaBosnia and HerzegovinaBrazilBulgariaBurma/MyanmarCabo VerdeCambodiaCameroonCanadaCaribbeanCentral AmericaChileChinaColombiaCongoCosta RicaCroatiaCubaCzechoslovakiaDenmarkDominicaDominican RepublicEastern AfricaEastern AsiaEastern EuropeEcuadorEgyptEl SalvadorEnglandEritreaEthiopiaEuropeFijiFranceGermanyGhanaGreeceGrenadaGuatemalaGuyanaHaitiHondurasHong KongHungaryIndiaIndonesiaIranIraqIrelandIsraelItalyJamaicaJapanJordanKazakhstanKenyaKoreaKuwaitLaosLatin AmericaLatviaLebanonLiberiaLithuaniaMalaysiaMexicoMicronesiaMiddle AfricaMoldovaMoroccoNepalNetherlandsNicaraguaNigeriaNorth AmericaNorth MacedoniaNorthern AfricaNorthern EuropeNorwayOceaniaPakistanPanamaPeruPhilippinesPolandPortugalRomaniaRussiaSaudi ArabiaScotlandSenegalSerbiaSierra LeoneSingaporeSomaliaSouth AfricaSouth AmericaSouth Central AsiaSouth Eastern AsiaSouthern EuropeSpainSri LankaSt. Vincent and the GrenadinesSudanSwedenSwitzerlandSyriaTaiwanThailandTrinidad and TobagoTurkeyUgandaUkraineUruguayUzbekistanVenezuelaVietnamWest IndiesWestern AfricaWestern AsiaWestern EuropeYemenZaireZimbabweAzores
Disability Age 18 to 34
Income
Poverty
Unemployment
Labor Participation
Family Structure
Vehicle Availability
Education Level
Disability

Disability Age 18 to 34 Comparison

Turks

Cypriots

Exceptional
Exceptional
6.2%
DISABILITY AGE 18 TO 34
97.8/ 100
METRIC RATING
89th/ 347
METRIC RANK
6.0%
DISABILITY AGE 18 TO 34
99.2/ 100
METRIC RATING
73rd/ 347
METRIC RANK

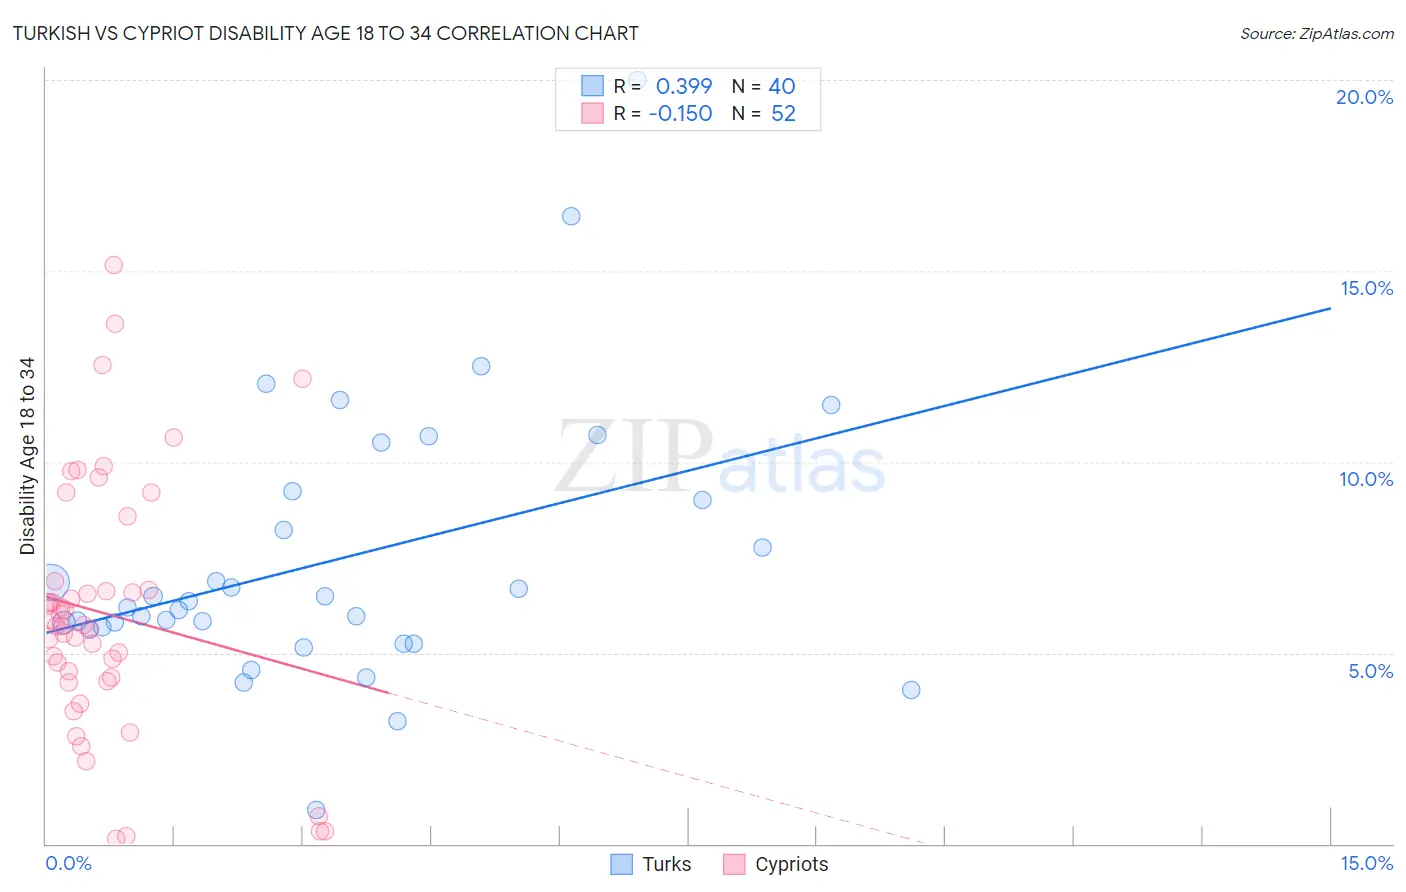
Turkish vs Cypriot Disability Age 18 to 34 Correlation Chart

The statistical analysis conducted on geographies consisting of 271,484,805 people shows a mild positive correlation between the proportion of Turks and percentage of population with a disability between the ages 18 and 35 in the United States with a correlation coefficient (R) of 0.399 and weighted average of 6.2%. Similarly, the statistical analysis conducted on geographies consisting of 61,834,624 people shows a poor negative correlation between the proportion of Cypriots and percentage of population with a disability between the ages 18 and 35 in the United States with a correlation coefficient (R) of -0.150 and weighted average of 6.0%, a difference of 2.1%.
Turkish vs Cypriot Disability Age 18 to 34

Disability Age 18 to 34 Correlation Summary

MeasurementTurkishCypriot
Minimum0.89%0.14%
Maximum20.0%15.2%
Range19.1%15.0%
Mean7.4%6.0%
Median6.3%5.7%
Interquartile 25% (IQ1)5.6%4.3%
Interquartile 75% (IQ3)9.1%6.7%
Interquartile Range (IQR)3.5%2.5%
Standard Deviation (Sample)3.6%3.3%
Standard Deviation (Population)3.6%3.3%

Demographics Similar to Turks and Cypriots by Disability Age 18 to 34

In terms of disability age 18 to 34, the demographic groups most similar to Turks are Immigrants from Vietnam (6.2%, a difference of 0.040%), Cambodian (6.2%, a difference of 0.060%), Immigrants from Eastern Europe (6.2%, a difference of 0.090%), Immigrants from Philippines (6.2%, a difference of 0.11%), and Immigrants from Kuwait (6.2%, a difference of 0.17%). Similarly, the demographic groups most similar to Cypriots are Immigrants from Lebanon (6.0%, a difference of 0.0%), Haitian (6.0%, a difference of 0.090%), Immigrants from Japan (6.0%, a difference of 0.12%), Immigrants from Turkey (6.1%, a difference of 0.38%), and Immigrants from Western Asia (6.1%, a difference of 0.66%).
DemographicsRating | RankDisability Age 18 to 34
Immigrants | Japan
99.3
/100
|
#71
Exceptional
6.0%
Immigrants | Lebanon
99.2
/100
|
#72
Exceptional
6.0%
Cypriots
99.2
/100
|
#73
Exceptional
6.0%
Haitians
99.2
/100
|
#74
Exceptional
6.0%
Immigrants | Turkey
99.1
/100
|
#75
Exceptional
6.1%
Immigrants | Western Asia
98.9
/100
|
#76
Exceptional
6.1%
Immigrants | Russia
98.9
/100
|
#77
Exceptional
6.1%
Assyrians/Chaldeans/Syriacs
98.9
/100
|
#78
Exceptional
6.1%
Afghans
98.7
/100
|
#79
Exceptional
6.1%
Immigrants | Chile
98.5
/100
|
#80
Exceptional
6.1%
Immigrants | Australia
98.5
/100
|
#81
Exceptional
6.1%
Immigrants | Northern Africa
98.4
/100
|
#82
Exceptional
6.1%
Barbadians
98.3
/100
|
#83
Exceptional
6.1%
Israelis
98.3
/100
|
#84
Exceptional
6.1%
Immigrants | Ireland
98.2
/100
|
#85
Exceptional
6.1%
Immigrants | Kuwait
98.0
/100
|
#86
Exceptional
6.2%
Immigrants | Eastern Europe
97.9
/100
|
#87
Exceptional
6.2%
Cambodians
97.8
/100
|
#88
Exceptional
6.2%
Turks
97.8
/100
|
#89
Exceptional
6.2%
Immigrants | Vietnam
97.7
/100
|
#90
Exceptional
6.2%
Immigrants | Philippines
97.6
/100
|
#91
Exceptional
6.2%