Trinidadian and Tobagonian vs Argentinean Disability Age Over 75
COMPARE
Trinidadian and Tobagonian
Argentinean
Disability Age Over 75
Disability Age Over 75 Comparison
Trinidadians and Tobagonians
Argentineans
47.7%
DISABILITY AGE OVER 75
20.0/ 100
METRIC RATING
203rd/ 347
METRIC RANK
46.2%
DISABILITY AGE OVER 75
98.7/ 100
METRIC RATING
83rd/ 347
METRIC RANK
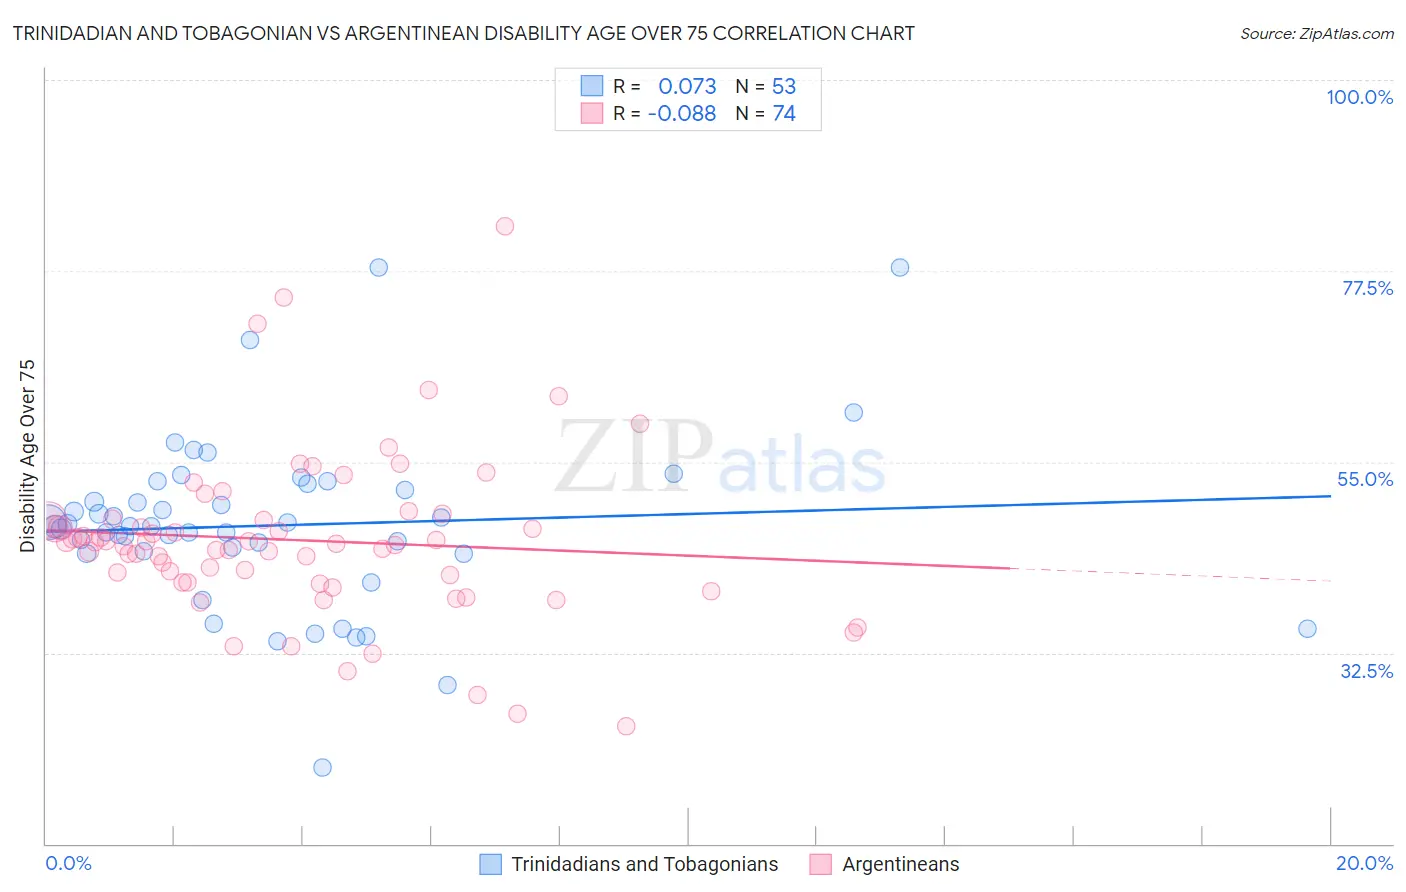
Trinidadian and Tobagonian vs Argentinean Disability Age Over 75 Correlation Chart
The statistical analysis conducted on geographies consisting of 219,483,630 people shows a slight positive correlation between the proportion of Trinidadians and Tobagonians and percentage of population with a disability over the age of 75 in the United States with a correlation coefficient (R) of 0.073 and weighted average of 47.7%. Similarly, the statistical analysis conducted on geographies consisting of 296,846,003 people shows a slight negative correlation between the proportion of Argentineans and percentage of population with a disability over the age of 75 in the United States with a correlation coefficient (R) of -0.088 and weighted average of 46.2%, a difference of 3.3%.
Disability Age Over 75 Correlation Summary
| Measurement | Trinidadian and Tobagonian | Argentinean |
| Minimum | 18.9% | 23.9% |
| Maximum | 77.9% | 82.8% |
| Range | 59.0% | 58.9% |
| Mean | 47.5% | 45.8% |
| Median | 47.4% | 45.4% |
| Interquartile 25% (IQ1) | 44.3% | 40.8% |
| Interquartile 75% (IQ3) | 52.0% | 48.1% |
| Interquartile Range (IQR) | 7.7% | 7.3% |
| Standard Deviation (Sample) | 10.2% | 9.7% |
| Standard Deviation (Population) | 10.1% | 9.7% |
Similar Demographics by Disability Age Over 75
Demographics Similar to Trinidadians and Tobagonians by Disability Age Over 75
In terms of disability age over 75, the demographic groups most similar to Trinidadians and Tobagonians are Immigrants from Bahamas (47.7%, a difference of 0.020%), Immigrants from Cuba (47.7%, a difference of 0.030%), Nigerian (47.7%, a difference of 0.030%), Immigrants from Ghana (47.7%, a difference of 0.030%), and Jamaican (47.7%, a difference of 0.040%).
| Demographics | Rating | Rank | Disability Age Over 75 |
| Immigrants | Portugal | 23.8 /100 | #196 | Fair 47.6% |
| Pakistanis | 23.4 /100 | #197 | Fair 47.7% |
| Immigrants | Ukraine | 23.2 /100 | #198 | Fair 47.7% |
| Immigrants | Eritrea | 22.4 /100 | #199 | Fair 47.7% |
| Immigrants | Somalia | 21.4 /100 | #200 | Fair 47.7% |
| Immigrants | Cuba | 20.9 /100 | #201 | Fair 47.7% |
| Immigrants | Bahamas | 20.7 /100 | #202 | Fair 47.7% |
| Trinidadians and Tobagonians | 20.0 /100 | #203 | Fair 47.7% |
| Nigerians | 19.2 /100 | #204 | Poor 47.7% |
| Immigrants | Ghana | 19.1 /100 | #205 | Poor 47.7% |
| Jamaicans | 19.0 /100 | #206 | Poor 47.7% |
| Immigrants | Syria | 17.4 /100 | #207 | Poor 47.8% |
| Immigrants | Senegal | 16.9 /100 | #208 | Poor 47.8% |
| Immigrants | Indonesia | 14.2 /100 | #209 | Poor 47.8% |
| Vietnamese | 11.9 /100 | #210 | Poor 47.9% |
Demographics Similar to Argentineans by Disability Age Over 75
In terms of disability age over 75, the demographic groups most similar to Argentineans are Immigrants from Latvia (46.2%, a difference of 0.0%), Immigrants from Jordan (46.2%, a difference of 0.010%), Soviet Union (46.2%, a difference of 0.020%), New Zealander (46.2%, a difference of 0.020%), and Swiss (46.2%, a difference of 0.030%).
| Demographics | Rating | Rank | Disability Age Over 75 |
| Slavs | 98.9 /100 | #76 | Exceptional 46.1% |
| Immigrants | Eastern Asia | 98.9 /100 | #77 | Exceptional 46.2% |
| Immigrants | Western Europe | 98.8 /100 | #78 | Exceptional 46.2% |
| Swiss | 98.8 /100 | #79 | Exceptional 46.2% |
| Soviet Union | 98.8 /100 | #80 | Exceptional 46.2% |
| New Zealanders | 98.8 /100 | #81 | Exceptional 46.2% |
| Immigrants | Latvia | 98.7 /100 | #82 | Exceptional 46.2% |
| Argentineans | 98.7 /100 | #83 | Exceptional 46.2% |
| Immigrants | Jordan | 98.7 /100 | #84 | Exceptional 46.2% |
| Immigrants | Southern Europe | 98.6 /100 | #85 | Exceptional 46.2% |
| Romanians | 98.6 /100 | #86 | Exceptional 46.2% |
| Danes | 98.6 /100 | #87 | Exceptional 46.2% |
| Uruguayans | 98.4 /100 | #88 | Exceptional 46.2% |
| Immigrants | Saudi Arabia | 98.4 /100 | #89 | Exceptional 46.3% |
| Northern Europeans | 98.3 /100 | #90 | Exceptional 46.3% |