Tohono O'odham vs Northern European Disability Age 65 to 74
COMPARE
Tohono O'odham
Northern European
Disability Age 65 to 74
Disability Age 65 to 74 Comparison
Tohono O'odham
Northern Europeans
36.0%
DISABILITY AGE 65 TO 74
0.0/ 100
METRIC RATING
345th/ 347
METRIC RANK
22.6%
DISABILITY AGE 65 TO 74
88.9/ 100
METRIC RATING
133rd/ 347
METRIC RANK
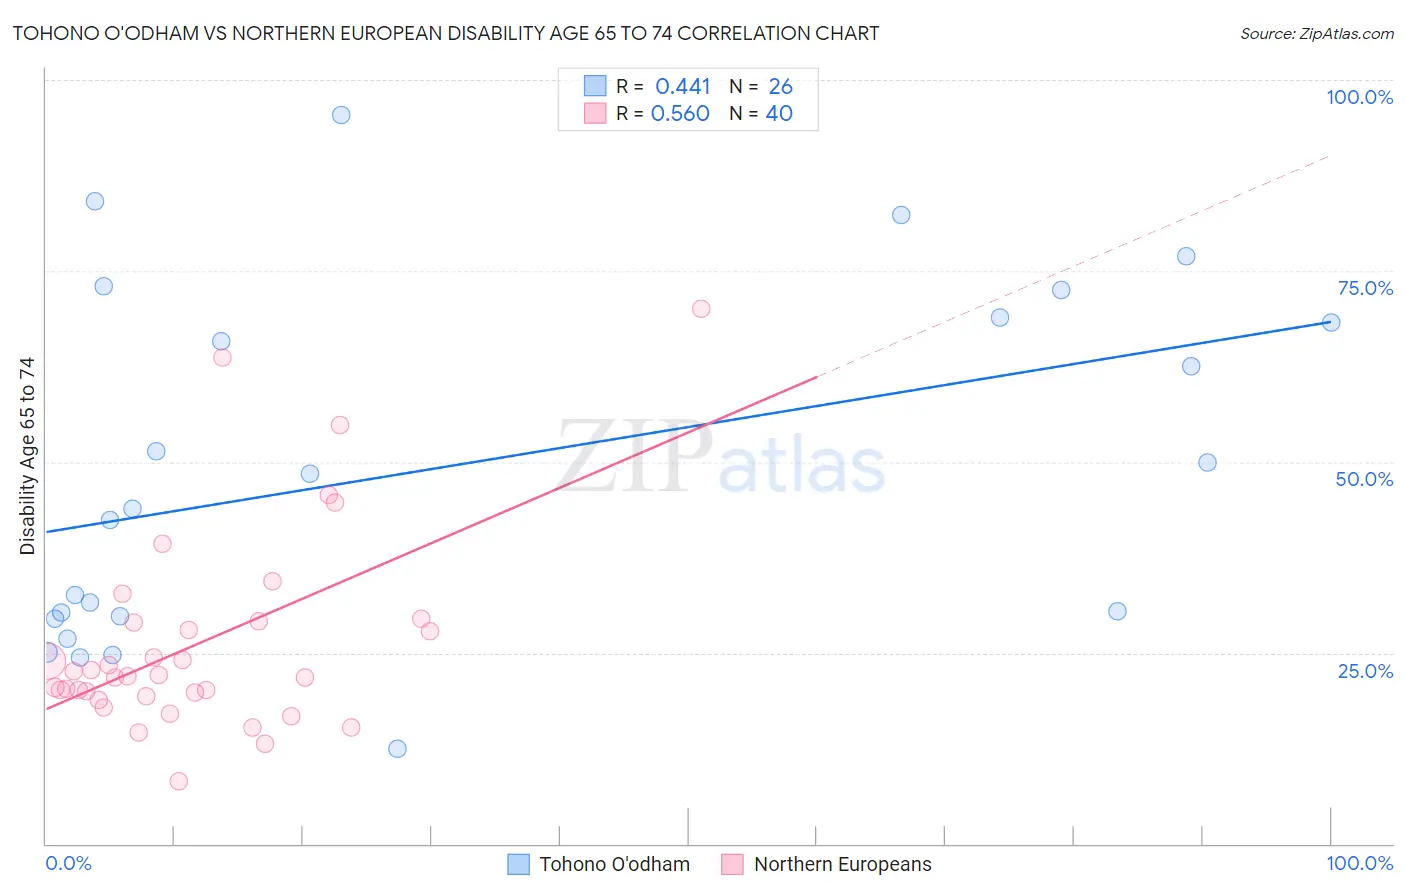
Tohono O'odham vs Northern European Disability Age 65 to 74 Correlation Chart
The statistical analysis conducted on geographies consisting of 58,691,657 people shows a moderate positive correlation between the proportion of Tohono O'odham and percentage of population with a disability between the ages 65 and 75 in the United States with a correlation coefficient (R) of 0.441 and weighted average of 36.0%. Similarly, the statistical analysis conducted on geographies consisting of 405,506,893 people shows a substantial positive correlation between the proportion of Northern Europeans and percentage of population with a disability between the ages 65 and 75 in the United States with a correlation coefficient (R) of 0.560 and weighted average of 22.6%, a difference of 59.2%.
Disability Age 65 to 74 Correlation Summary
| Measurement | Tohono O'odham | Northern European |
| Minimum | 12.4% | 8.1% |
| Maximum | 95.5% | 70.0% |
| Range | 83.1% | 61.9% |
| Mean | 49.4% | 26.3% |
| Median | 46.1% | 22.0% |
| Interquartile 25% (IQ1) | 29.8% | 19.6% |
| Interquartile 75% (IQ3) | 69.0% | 29.0% |
| Interquartile Range (IQR) | 39.1% | 9.4% |
| Standard Deviation (Sample) | 23.1% | 13.2% |
| Standard Deviation (Population) | 22.6% | 13.0% |
Similar Demographics by Disability Age 65 to 74
Demographics Similar to Tohono O'odham by Disability Age 65 to 74
In terms of disability age 65 to 74, the demographic groups most similar to Tohono O'odham are Inupiat (34.5%, a difference of 4.3%), Yup'ik (37.8%, a difference of 5.0%), Pima (38.6%, a difference of 7.1%), Navajo (33.3%, a difference of 8.1%), and Pueblo (33.1%, a difference of 8.9%).
| Demographics | Rating | Rank | Disability Age 65 to 74 |
| Colville | 0.0 /100 | #333 | Tragic 30.5% |
| Alaska Natives | 0.0 /100 | #334 | Tragic 30.6% |
| Cheyenne | 0.0 /100 | #335 | Tragic 31.1% |
| Yuman | 0.0 /100 | #336 | Tragic 31.5% |
| Houma | 0.0 /100 | #337 | Tragic 32.3% |
| Alaskan Athabascans | 0.0 /100 | #338 | Tragic 32.4% |
| Kiowa | 0.0 /100 | #339 | Tragic 32.6% |
| Lumbee | 0.0 /100 | #340 | Tragic 32.7% |
| Tsimshian | 0.0 /100 | #341 | Tragic 32.9% |
| Pueblo | 0.0 /100 | #342 | Tragic 33.1% |
| Navajo | 0.0 /100 | #343 | Tragic 33.3% |
| Inupiat | 0.0 /100 | #344 | Tragic 34.5% |
| Tohono O'odham | 0.0 /100 | #345 | Tragic 36.0% |
| Yup'ik | 0.0 /100 | #346 | Tragic 37.8% |
| Pima | 0.0 /100 | #347 | Tragic 38.6% |
Demographics Similar to Northern Europeans by Disability Age 65 to 74
In terms of disability age 65 to 74, the demographic groups most similar to Northern Europeans are Costa Rican (22.6%, a difference of 0.050%), Afghan (22.6%, a difference of 0.050%), Immigrants from Nepal (22.6%, a difference of 0.080%), Immigrants from Ukraine (22.6%, a difference of 0.080%), and Ethiopian (22.7%, a difference of 0.15%).
| Demographics | Rating | Rank | Disability Age 65 to 74 |
| Lebanese | 92.2 /100 | #126 | Exceptional 22.5% |
| Slovaks | 91.6 /100 | #127 | Exceptional 22.5% |
| Immigrants | Costa Rica | 90.4 /100 | #128 | Exceptional 22.6% |
| Immigrants | Uruguay | 90.1 /100 | #129 | Exceptional 22.6% |
| Immigrants | Albania | 90.0 /100 | #130 | Excellent 22.6% |
| Immigrants | Nepal | 89.4 /100 | #131 | Excellent 22.6% |
| Costa Ricans | 89.2 /100 | #132 | Excellent 22.6% |
| Northern Europeans | 88.9 /100 | #133 | Excellent 22.6% |
| Afghans | 88.6 /100 | #134 | Excellent 22.6% |
| Immigrants | Ukraine | 88.4 /100 | #135 | Excellent 22.6% |
| Ethiopians | 87.9 /100 | #136 | Excellent 22.7% |
| Taiwanese | 87.6 /100 | #137 | Excellent 22.7% |
| Immigrants | Moldova | 87.3 /100 | #138 | Excellent 22.7% |
| Immigrants | Syria | 85.8 /100 | #139 | Excellent 22.7% |
| Ugandans | 85.4 /100 | #140 | Excellent 22.7% |