Thai vs Immigrants from Chile Disability Age 65 to 74

COMPARE

Thai
Race
Ancestry
AfghanAfricanAlaska NativeAlaskan AthabascanAlbanianAleutAlsatianAmericanApacheArabArapahoArgentineanArmenianAssyrian/Chaldean/SyriacAustralianAustrianBahamianBangladeshiBarbadianBasqueBelgianBelizeanBermudanBhutaneseBlackfeetBolivianBrazilianBritishBritish West IndianBulgarianBurmeseCajunCambodianCanadianCape VerdeanCarpatho RusynCelticCentral AmericanCentral American IndianCherokeeCheyenneChickasawChileanChineseChippewaChoctawColombianColvilleComancheCosta RicanCreeCreekCroatianCrowCubanCypriotCzechCzechoslovakianDanishDelawareDominicanDutchDutch West IndianEastern EuropeanEcuadorianEgyptianEnglishEstonianEthiopianEuropeanFijianFilipinoFinnishFrenchFrench American IndianFrench CanadianGermanGerman RussianGhanaianGreekGuamanian/ChamorroGuatemalanGuyaneseHaitianHmongHonduranHopiHoumaHungarianIcelanderIndian (Asian)IndonesianInupiatIranianIraqiIrishIroquoisIsraeliItalianJamaicanJapaneseJordanianKenyanKiowaKoreanLaotianLatvianLebaneseLiberianLithuanianLumbeeLuxembourgerMacedonianMalaysianMalteseMarshalleseMenomineeMexicanMexican American IndianMongolianMoroccanNative HawaiianNavajoNepaleseNew ZealanderNicaraguanNigerianNorthern EuropeanNorwegianOkinawanOsageOttawaPaiutePakistaniPalestinianPanamanianParaguayanPennsylvania GermanPeruvianPimaPolishPortuguesePotawatomiPuebloPuerto RicanPuget Sound SalishRomanianRussianSalvadoranSamoanScandinavianScotch-IrishScottishSeminoleSenegaleseSerbianShoshoneSierra LeoneanSiouxSlavicSlovakSloveneSomaliSouth AfricanSouth AmericanSouth American IndianSoviet UnionSpaniardSpanishSpanish AmericanSpanish American IndianSri LankanSubsaharan AfricanSudaneseSwedishSwissSyrianTaiwaneseThaiTlingit-HaidaTohono O'OdhamTonganTrinidadian and TobagonianTsimshianTurkishU.S. Virgin IslanderUgandanUkrainianUruguayanUteVenezuelanVietnameseWelshWest IndianYakamaYaquiYugoslavianYumanYup'ikZimbabwean
Immigration
NonimmigrantsImmigrantsAfghanistanAfricaAlbaniaArgentinaArmeniaAsiaAustraliaAustriaBahamasBangladeshBarbadosBelarusBelgiumBelizeBoliviaBosnia and HerzegovinaBrazilBulgariaBurma/MyanmarCabo VerdeCambodiaCameroonCanadaCaribbeanCentral AmericaChinaColombiaCongoCosta RicaCroatiaCubaCzechoslovakiaDenmarkDominicaDominican RepublicEastern AfricaEastern AsiaEastern EuropeEcuadorEgyptEl SalvadorEnglandEritreaEthiopiaEuropeFijiFranceGermanyGhanaGreeceGrenadaGuatemalaGuyanaHaitiHondurasHong KongHungaryIndiaIndonesiaIranIraqIrelandIsraelItalyJamaicaJapanJordanKazakhstanKenyaKoreaKuwaitLaosLatin AmericaLatviaLebanonLiberiaLithuaniaMalaysiaMexicoMicronesiaMiddle AfricaMoldovaMoroccoNepalNetherlandsNicaraguaNigeriaNorth AmericaNorth MacedoniaNorthern AfricaNorthern EuropeNorwayOceaniaPakistanPanamaPeruPhilippinesPolandPortugalRomaniaRussiaSaudi ArabiaScotlandSenegalSerbiaSierra LeoneSingaporeSomaliaSouth AfricaSouth AmericaSouth Central AsiaSouth Eastern AsiaSouthern EuropeSpainSri LankaSt. Vincent and the GrenadinesSudanSwedenSwitzerlandSyriaTaiwanThailandTrinidad and TobagoTurkeyUgandaUkraineUruguayUzbekistanVenezuelaVietnamWest IndiesWestern AfricaWestern AsiaWestern EuropeYemenZaireZimbabweAzores
Immigrants from Chile
Race
Ancestry
AfghanAfricanAlaska NativeAlaskan AthabascanAlbanianAleutAlsatianAmericanApacheArabArapahoArgentineanArmenianAssyrian/Chaldean/SyriacAustralianAustrianBahamianBangladeshiBarbadianBasqueBelgianBelizeanBermudanBhutaneseBlackfeetBolivianBrazilianBritishBritish West IndianBulgarianBurmeseCajunCambodianCanadianCape VerdeanCarpatho RusynCelticCentral AmericanCentral American IndianCherokeeCheyenneChickasawChileanChineseChippewaChoctawColombianColvilleComancheCosta RicanCreeCreekCroatianCrowCubanCypriotCzechCzechoslovakianDanishDelawareDominicanDutchDutch West IndianEastern EuropeanEcuadorianEgyptianEnglishEstonianEthiopianEuropeanFijianFilipinoFinnishFrenchFrench American IndianFrench CanadianGermanGerman RussianGhanaianGreekGuamanian/ChamorroGuatemalanGuyaneseHaitianHmongHonduranHopiHoumaHungarianIcelanderIndian (Asian)IndonesianInupiatIranianIraqiIrishIroquoisIsraeliItalianJamaicanJapaneseJordanianKenyanKiowaKoreanLaotianLatvianLebaneseLiberianLithuanianLumbeeLuxembourgerMacedonianMalaysianMalteseMarshalleseMenomineeMexicanMexican American IndianMongolianMoroccanNative HawaiianNavajoNepaleseNew ZealanderNicaraguanNigerianNorthern EuropeanNorwegianOkinawanOsageOttawaPaiutePakistaniPalestinianPanamanianParaguayanPennsylvania GermanPeruvianPimaPolishPortuguesePotawatomiPuebloPuerto RicanPuget Sound SalishRomanianRussianSalvadoranSamoanScandinavianScotch-IrishScottishSeminoleSenegaleseSerbianShoshoneSierra LeoneanSiouxSlavicSlovakSloveneSomaliSouth AfricanSouth AmericanSouth American IndianSoviet UnionSpaniardSpanishSpanish AmericanSpanish American IndianSri LankanSubsaharan AfricanSudaneseSwedishSwissSyrianTaiwaneseTlingit-HaidaTohono O'OdhamTonganTrinidadian and TobagonianTsimshianTurkishU.S. Virgin IslanderUgandanUkrainianUruguayanUteVenezuelanVietnameseWelshWest IndianYakamaYaquiYugoslavianYumanYup'ikZimbabwean
Immigration
NonimmigrantsImmigrantsAfghanistanAfricaAlbaniaArgentinaArmeniaAsiaAustraliaAustriaBahamasBangladeshBarbadosBelarusBelgiumBelizeBoliviaBosnia and HerzegovinaBrazilBulgariaBurma/MyanmarCabo VerdeCambodiaCameroonCanadaCaribbeanCentral AmericaChileChinaColombiaCongoCosta RicaCroatiaCubaCzechoslovakiaDenmarkDominicaDominican RepublicEastern AfricaEastern AsiaEastern EuropeEcuadorEgyptEl SalvadorEnglandEritreaEthiopiaEuropeFijiFranceGermanyGhanaGreeceGrenadaGuatemalaGuyanaHaitiHondurasHong KongHungaryIndiaIndonesiaIranIraqIrelandIsraelItalyJamaicaJapanJordanKazakhstanKenyaKoreaKuwaitLaosLatin AmericaLatviaLebanonLiberiaLithuaniaMalaysiaMexicoMicronesiaMiddle AfricaMoldovaMoroccoNepalNetherlandsNicaraguaNigeriaNorth AmericaNorth MacedoniaNorthern AfricaNorthern EuropeNorwayOceaniaPakistanPanamaPeruPhilippinesPolandPortugalRomaniaRussiaSaudi ArabiaScotlandSenegalSerbiaSierra LeoneSingaporeSomaliaSouth AfricaSouth AmericaSouth Central AsiaSouth Eastern AsiaSouthern EuropeSpainSri LankaSt. Vincent and the GrenadinesSudanSwedenSwitzerlandSyriaTaiwanThailandTrinidad and TobagoTurkeyUgandaUkraineUruguayUzbekistanVenezuelaVietnamWest IndiesWestern AfricaWestern AsiaWestern EuropeYemenZaireZimbabweAzores
Disability Age 65 to 74
Income
Poverty
Unemployment
Labor Participation
Family Structure
Vehicle Availability
Education Level
Disability

Disability Age 65 to 74 Comparison

Thais

Immigrants from Chile

Exceptional
Exceptional
20.1%
DISABILITY AGE 65 TO 74
100.0/ 100
METRIC RATING
8th/ 347
METRIC RANK
22.1%
DISABILITY AGE 65 TO 74
97.7/ 100
METRIC RATING
94th/ 347
METRIC RANK

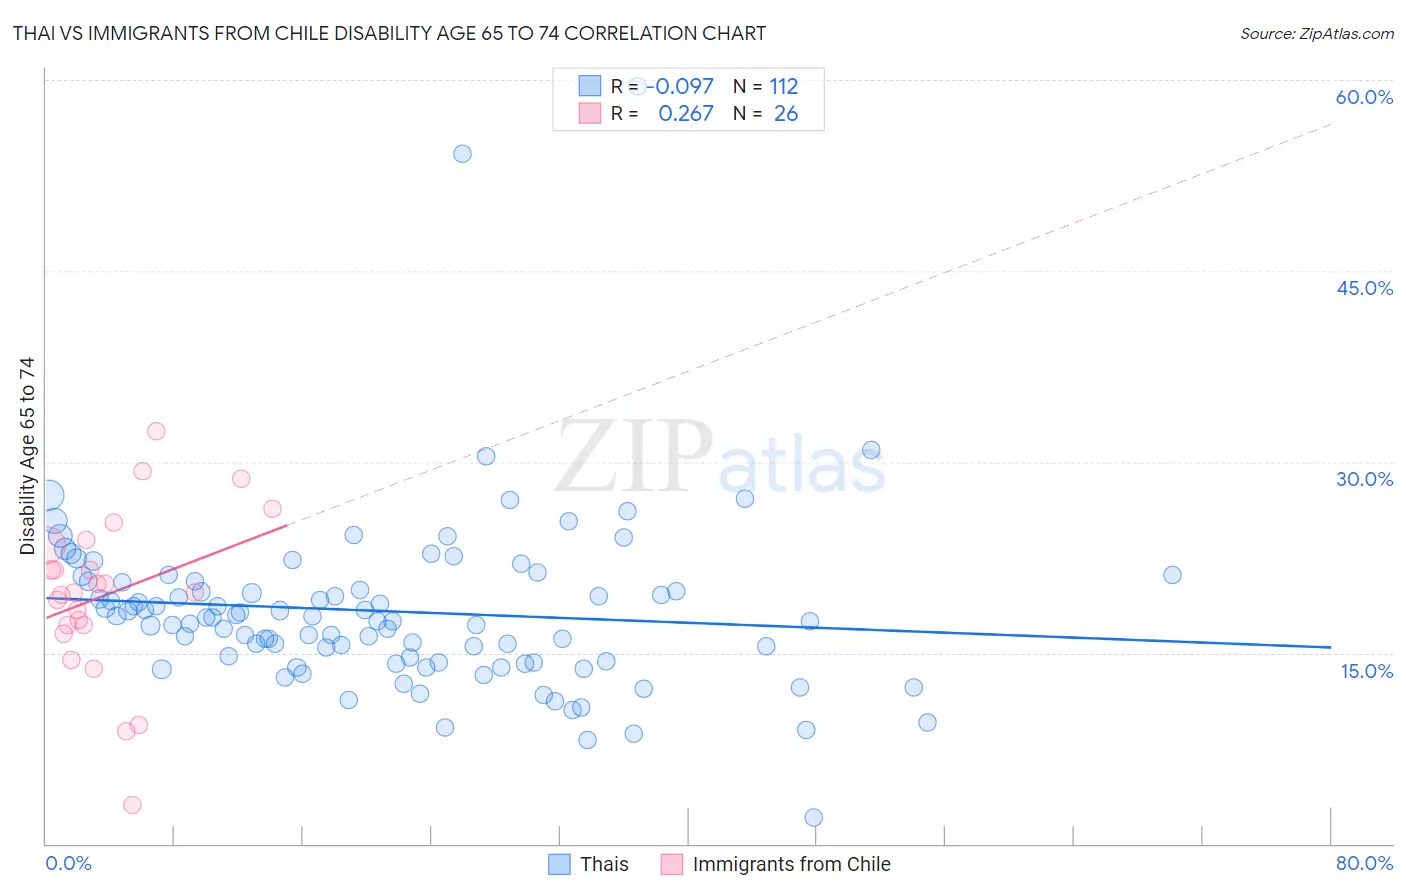
Thai vs Immigrants from Chile Disability Age 65 to 74 Correlation Chart

The statistical analysis conducted on geographies consisting of 474,585,804 people shows a slight negative correlation between the proportion of Thais and percentage of population with a disability between the ages 65 and 75 in the United States with a correlation coefficient (R) of -0.097 and weighted average of 20.1%. Similarly, the statistical analysis conducted on geographies consisting of 218,493,158 people shows a weak positive correlation between the proportion of Immigrants from Chile and percentage of population with a disability between the ages 65 and 75 in the United States with a correlation coefficient (R) of 0.267 and weighted average of 22.1%, a difference of 9.9%.
Thai vs Immigrants from Chile Disability Age 65 to 74

Disability Age 65 to 74 Correlation Summary

MeasurementThaiImmigrants from Chile
Minimum2.1%3.0%
Maximum59.5%32.4%
Range57.4%29.4%
Mean18.3%19.6%
Median17.6%19.7%
Interquartile 25% (IQ1)14.3%17.1%
Interquartile 75% (IQ3)20.6%23.5%
Interquartile Range (IQR)6.3%6.4%
Standard Deviation (Sample)7.1%6.5%
Standard Deviation (Population)7.1%6.3%

Similar Demographics by Disability Age 65 to 74

Demographics Similar to Thais by Disability Age 65 to 74

In terms of disability age 65 to 74, the demographic groups most similar to Thais are Cypriot (20.1%, a difference of 0.040%), Iranian (19.9%, a difference of 0.70%), Immigrants from Israel (19.9%, a difference of 0.82%), Immigrants from China (20.3%, a difference of 0.96%), and Immigrants from Eastern Asia (20.3%, a difference of 1.0%).
DemographicsRating | RankDisability Age 65 to 74
Immigrants | Taiwan
100.0
/100
|
#1
Exceptional
18.8%
Filipinos
100.0
/100
|
#2
Exceptional
19.0%
Immigrants | India
100.0
/100
|
#3
Exceptional
19.7%
Immigrants | Hong Kong
100.0
/100
|
#4
Exceptional
19.9%
Immigrants | Israel
100.0
/100
|
#5
Exceptional
19.9%
Iranians
100.0
/100
|
#6
Exceptional
19.9%
Cypriots
100.0
/100
|
#7
Exceptional
20.1%
Thais
100.0
/100
|
#8
Exceptional
20.1%
Immigrants | China
100.0
/100
|
#9
Exceptional
20.3%
Immigrants | Eastern Asia
100.0
/100
|
#10
Exceptional
20.3%
Immigrants | Ireland
100.0
/100
|
#11
Exceptional
20.3%
Immigrants | Korea
100.0
/100
|
#12
Exceptional
20.4%
Immigrants | Singapore
100.0
/100
|
#13
Exceptional
20.4%
Indians (Asian)
100.0
/100
|
#14
Exceptional
20.5%
Paraguayans
100.0
/100
|
#15
Exceptional
20.5%

Demographics Similar to Immigrants from Chile by Disability Age 65 to 74

In terms of disability age 65 to 74, the demographic groups most similar to Immigrants from Chile are Immigrants from Canada (22.1%, a difference of 0.020%), Polish (22.0%, a difference of 0.050%), Romanian (22.1%, a difference of 0.060%), Chilean (22.0%, a difference of 0.10%), and Italian (22.0%, a difference of 0.12%).
DemographicsRating | RankDisability Age 65 to 74
Australians
98.0
/100
|
#87
Exceptional
22.0%
Immigrants | Netherlands
97.9
/100
|
#88
Exceptional
22.0%
Immigrants | Kuwait
97.9
/100
|
#89
Exceptional
22.0%
Italians
97.9
/100
|
#90
Exceptional
22.0%
Chileans
97.9
/100
|
#91
Exceptional
22.0%
Poles
97.8
/100
|
#92
Exceptional
22.0%
Immigrants | Canada
97.8
/100
|
#93
Exceptional
22.1%
Immigrants | Chile
97.7
/100
|
#94
Exceptional
22.1%
Romanians
97.7
/100
|
#95
Exceptional
22.1%
Immigrants | North America
97.5
/100
|
#96
Exceptional
22.1%
Immigrants | Southern Europe
97.2
/100
|
#97
Exceptional
22.1%
Jordanians
96.9
/100
|
#98
Exceptional
22.2%
Immigrants | Colombia
96.8
/100
|
#99
Exceptional
22.2%
Uruguayans
96.5
/100
|
#100
Exceptional
22.2%
Immigrants | England
96.5
/100
|
#101
Exceptional
22.2%