Swiss vs Thai Female Disability
COMPARE
Swiss
Thai
Female Disability
Female Disability Comparison
Swiss
Thais
12.4%
FEMALE DISABILITY
14.9/ 100
METRIC RATING
210th/ 347
METRIC RANK
10.2%
FEMALE DISABILITY
100.0/ 100
METRIC RATING
4th/ 347
METRIC RANK
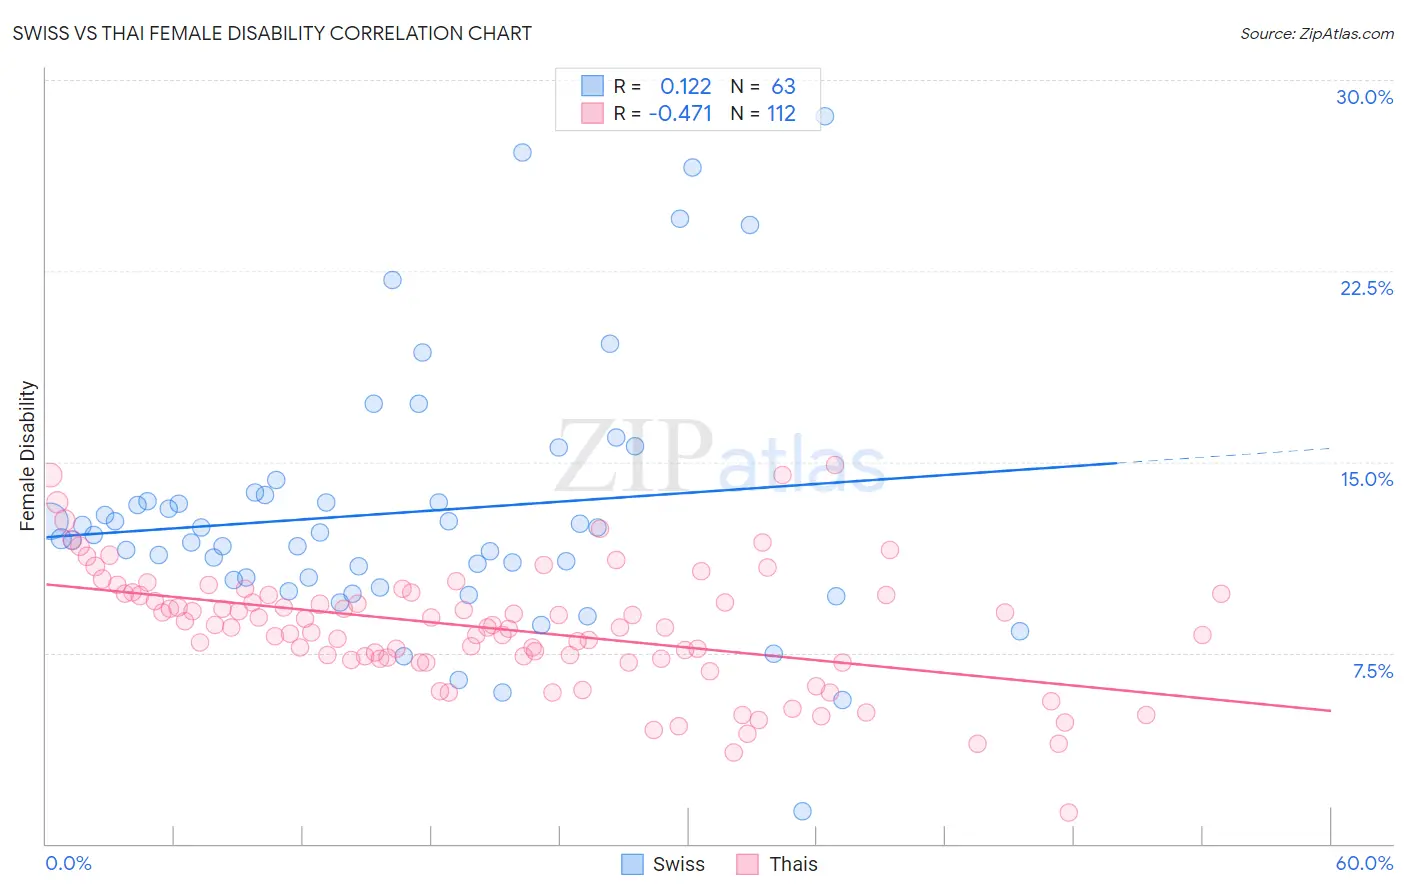
Swiss vs Thai Female Disability Correlation Chart
The statistical analysis conducted on geographies consisting of 464,961,657 people shows a poor positive correlation between the proportion of Swiss and percentage of females with a disability in the United States with a correlation coefficient (R) of 0.122 and weighted average of 12.4%. Similarly, the statistical analysis conducted on geographies consisting of 475,795,002 people shows a moderate negative correlation between the proportion of Thais and percentage of females with a disability in the United States with a correlation coefficient (R) of -0.471 and weighted average of 10.2%, a difference of 21.8%.
Female Disability Correlation Summary
| Measurement | Swiss | Thai |
| Minimum | 1.3% | 1.2% |
| Maximum | 28.6% | 14.9% |
| Range | 27.3% | 13.7% |
| Mean | 13.0% | 8.5% |
| Median | 12.1% | 8.5% |
| Interquartile 25% (IQ1) | 10.4% | 7.3% |
| Interquartile 75% (IQ3) | 13.7% | 9.8% |
| Interquartile Range (IQR) | 3.3% | 2.5% |
| Standard Deviation (Sample) | 5.1% | 2.4% |
| Standard Deviation (Population) | 5.1% | 2.4% |
Similar Demographics by Female Disability
Demographics Similar to Swiss by Female Disability
In terms of female disability, the demographic groups most similar to Swiss are Immigrants from Bosnia and Herzegovina (12.4%, a difference of 0.010%), Ute (12.4%, a difference of 0.010%), Immigrants from Thailand (12.4%, a difference of 0.030%), Mexican (12.4%, a difference of 0.050%), and Panamanian (12.4%, a difference of 0.11%).
| Demographics | Rating | Rank | Female Disability |
| Immigrants | Barbados | 21.1 /100 | #203 | Fair 12.3% |
| Immigrants | Zaire | 20.9 /100 | #204 | Fair 12.3% |
| Immigrants | Grenada | 20.5 /100 | #205 | Fair 12.4% |
| Immigrants | Cuba | 20.2 /100 | #206 | Fair 12.4% |
| Croatians | 20.2 /100 | #207 | Fair 12.4% |
| Basques | 17.5 /100 | #208 | Poor 12.4% |
| Mexicans | 15.7 /100 | #209 | Poor 12.4% |
| Swiss | 14.9 /100 | #210 | Poor 12.4% |
| Immigrants | Bosnia and Herzegovina | 14.8 /100 | #211 | Poor 12.4% |
| Ute | 14.7 /100 | #212 | Poor 12.4% |
| Immigrants | Thailand | 14.5 /100 | #213 | Poor 12.4% |
| Panamanians | 13.5 /100 | #214 | Poor 12.4% |
| Samoans | 13.4 /100 | #215 | Poor 12.4% |
| Immigrants | Burma/Myanmar | 13.3 /100 | #216 | Poor 12.4% |
| British | 12.7 /100 | #217 | Poor 12.4% |
Demographics Similar to Thais by Female Disability
In terms of female disability, the demographic groups most similar to Thais are Immigrants from Bolivia (10.3%, a difference of 0.82%), Immigrants from Taiwan (10.1%, a difference of 0.88%), Filipino (10.1%, a difference of 1.1%), Bolivian (10.4%, a difference of 1.7%), and Immigrants from India (10.0%, a difference of 2.1%).
| Demographics | Rating | Rank | Female Disability |
| Immigrants | India | 100.0 /100 | #1 | Exceptional 10.0% |
| Filipinos | 100.0 /100 | #2 | Exceptional 10.1% |
| Immigrants | Taiwan | 100.0 /100 | #3 | Exceptional 10.1% |
| Thais | 100.0 /100 | #4 | Exceptional 10.2% |
| Immigrants | Bolivia | 100.0 /100 | #5 | Exceptional 10.3% |
| Bolivians | 100.0 /100 | #6 | Exceptional 10.4% |
| Immigrants | Singapore | 100.0 /100 | #7 | Exceptional 10.4% |
| Immigrants | South Central Asia | 100.0 /100 | #8 | Exceptional 10.5% |
| Iranians | 100.0 /100 | #9 | Exceptional 10.6% |
| Immigrants | Hong Kong | 100.0 /100 | #10 | Exceptional 10.6% |
| Immigrants | Korea | 100.0 /100 | #11 | Exceptional 10.6% |
| Immigrants | Israel | 100.0 /100 | #12 | Exceptional 10.7% |
| Immigrants | Eastern Asia | 100.0 /100 | #13 | Exceptional 10.7% |
| Immigrants | China | 100.0 /100 | #14 | Exceptional 10.7% |
| Burmese | 100.0 /100 | #15 | Exceptional 10.7% |