Swedish vs Immigrants from Sri Lanka Ambulatory Disability
COMPARE
Swedish
Immigrants from Sri Lanka
Ambulatory Disability
Ambulatory Disability Comparison
Swedes
Immigrants from Sri Lanka
6.0%
AMBULATORY DISABILITY
83.1/ 100
METRIC RATING
141st/ 347
METRIC RANK
5.4%
AMBULATORY DISABILITY
100.0/ 100
METRIC RATING
18th/ 347
METRIC RANK
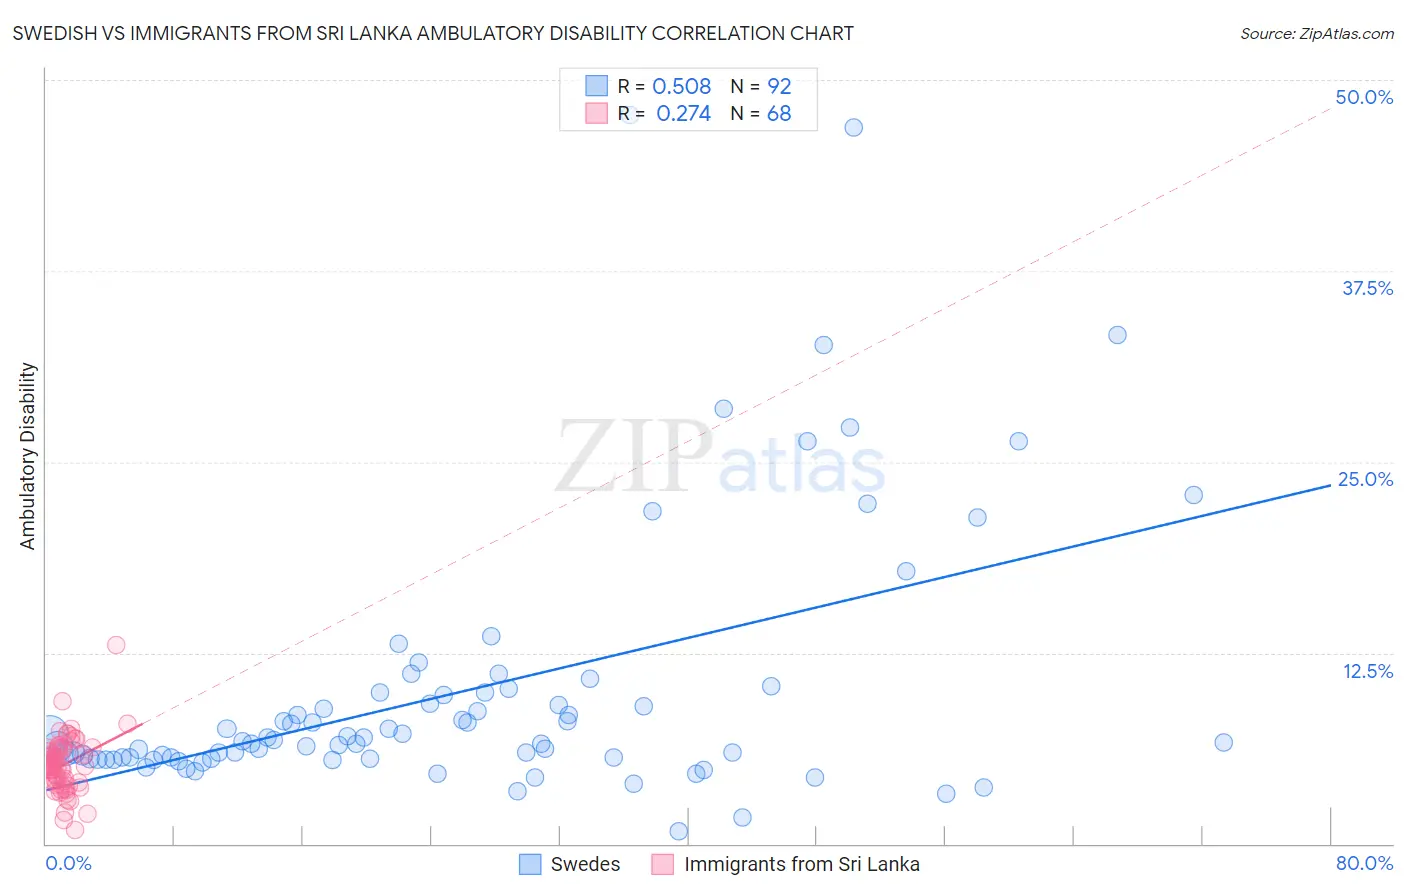
Swedish vs Immigrants from Sri Lanka Ambulatory Disability Correlation Chart
The statistical analysis conducted on geographies consisting of 538,852,545 people shows a substantial positive correlation between the proportion of Swedes and percentage of population with ambulatory disability in the United States with a correlation coefficient (R) of 0.508 and weighted average of 6.0%. Similarly, the statistical analysis conducted on geographies consisting of 149,694,852 people shows a weak positive correlation between the proportion of Immigrants from Sri Lanka and percentage of population with ambulatory disability in the United States with a correlation coefficient (R) of 0.274 and weighted average of 5.4%, a difference of 11.8%.
Ambulatory Disability Correlation Summary
| Measurement | Swedish | Immigrants from Sri Lanka |
| Minimum | 0.84% | 0.94% |
| Maximum | 47.7% | 13.0% |
| Range | 46.9% | 12.1% |
| Mean | 9.9% | 5.2% |
| Median | 6.7% | 5.1% |
| Interquartile 25% (IQ1) | 5.6% | 4.1% |
| Interquartile 75% (IQ3) | 9.8% | 6.2% |
| Interquartile Range (IQR) | 4.3% | 2.1% |
| Standard Deviation (Sample) | 8.7% | 1.8% |
| Standard Deviation (Population) | 8.6% | 1.8% |
Similar Demographics by Ambulatory Disability
Demographics Similar to Swedes by Ambulatory Disability
In terms of ambulatory disability, the demographic groups most similar to Swedes are Immigrants from Philippines (6.0%, a difference of 0.010%), Czech (6.0%, a difference of 0.020%), Romanian (6.0%, a difference of 0.020%), Macedonian (6.0%, a difference of 0.030%), and Immigrants from Zaire (6.0%, a difference of 0.050%).
| Demographics | Rating | Rank | Ambulatory Disability |
| Ute | 86.6 /100 | #134 | Excellent 6.0% |
| Immigrants | Italy | 85.0 /100 | #135 | Excellent 6.0% |
| Immigrants | North Macedonia | 84.1 /100 | #136 | Excellent 6.0% |
| Immigrants | Syria | 84.1 /100 | #137 | Excellent 6.0% |
| Immigrants | Hungary | 83.9 /100 | #138 | Excellent 6.0% |
| Immigrants | Zaire | 83.6 /100 | #139 | Excellent 6.0% |
| Czechs | 83.3 /100 | #140 | Excellent 6.0% |
| Swedes | 83.1 /100 | #141 | Excellent 6.0% |
| Immigrants | Philippines | 83.0 /100 | #142 | Excellent 6.0% |
| Romanians | 82.9 /100 | #143 | Excellent 6.0% |
| Macedonians | 82.8 /100 | #144 | Excellent 6.0% |
| Pakistanis | 82.5 /100 | #145 | Excellent 6.0% |
| Immigrants | Greece | 82.5 /100 | #146 | Excellent 6.0% |
| Immigrants | Moldova | 82.4 /100 | #147 | Excellent 6.0% |
| Immigrants | Eastern Europe | 82.0 /100 | #148 | Excellent 6.0% |
Demographics Similar to Immigrants from Sri Lanka by Ambulatory Disability
In terms of ambulatory disability, the demographic groups most similar to Immigrants from Sri Lanka are Immigrants from Ethiopia (5.4%, a difference of 0.010%), Indian (Asian) (5.4%, a difference of 0.10%), Ethiopian (5.4%, a difference of 0.12%), Immigrants from Kuwait (5.4%, a difference of 0.13%), and Immigrants from Hong Kong (5.3%, a difference of 0.34%).
| Demographics | Rating | Rank | Ambulatory Disability |
| Immigrants | Korea | 100.0 /100 | #11 | Exceptional 5.2% |
| Okinawans | 100.0 /100 | #12 | Exceptional 5.3% |
| Burmese | 100.0 /100 | #13 | Exceptional 5.3% |
| Immigrants | Eastern Asia | 100.0 /100 | #14 | Exceptional 5.3% |
| Immigrants | China | 100.0 /100 | #15 | Exceptional 5.3% |
| Immigrants | Hong Kong | 100.0 /100 | #16 | Exceptional 5.3% |
| Immigrants | Ethiopia | 100.0 /100 | #17 | Exceptional 5.4% |
| Immigrants | Sri Lanka | 100.0 /100 | #18 | Exceptional 5.4% |
| Indians (Asian) | 100.0 /100 | #19 | Exceptional 5.4% |
| Ethiopians | 100.0 /100 | #20 | Exceptional 5.4% |
| Immigrants | Kuwait | 100.0 /100 | #21 | Exceptional 5.4% |
| Immigrants | Israel | 100.0 /100 | #22 | Exceptional 5.4% |
| Tongans | 100.0 /100 | #23 | Exceptional 5.4% |
| Immigrants | Saudi Arabia | 100.0 /100 | #24 | Exceptional 5.4% |
| Zimbabweans | 100.0 /100 | #25 | Exceptional 5.4% |