Subsaharan African vs Immigrants from Yemen Cognitive Disability
COMPARE
Subsaharan African
Immigrants from Yemen
Cognitive Disability
Cognitive Disability Comparison
Sub-Saharan Africans
Immigrants from Yemen
18.5%
COGNITIVE DISABILITY
0.0/ 100
METRIC RATING
314th/ 347
METRIC RANK
18.8%
COGNITIVE DISABILITY
0.0/ 100
METRIC RATING
333rd/ 347
METRIC RANK
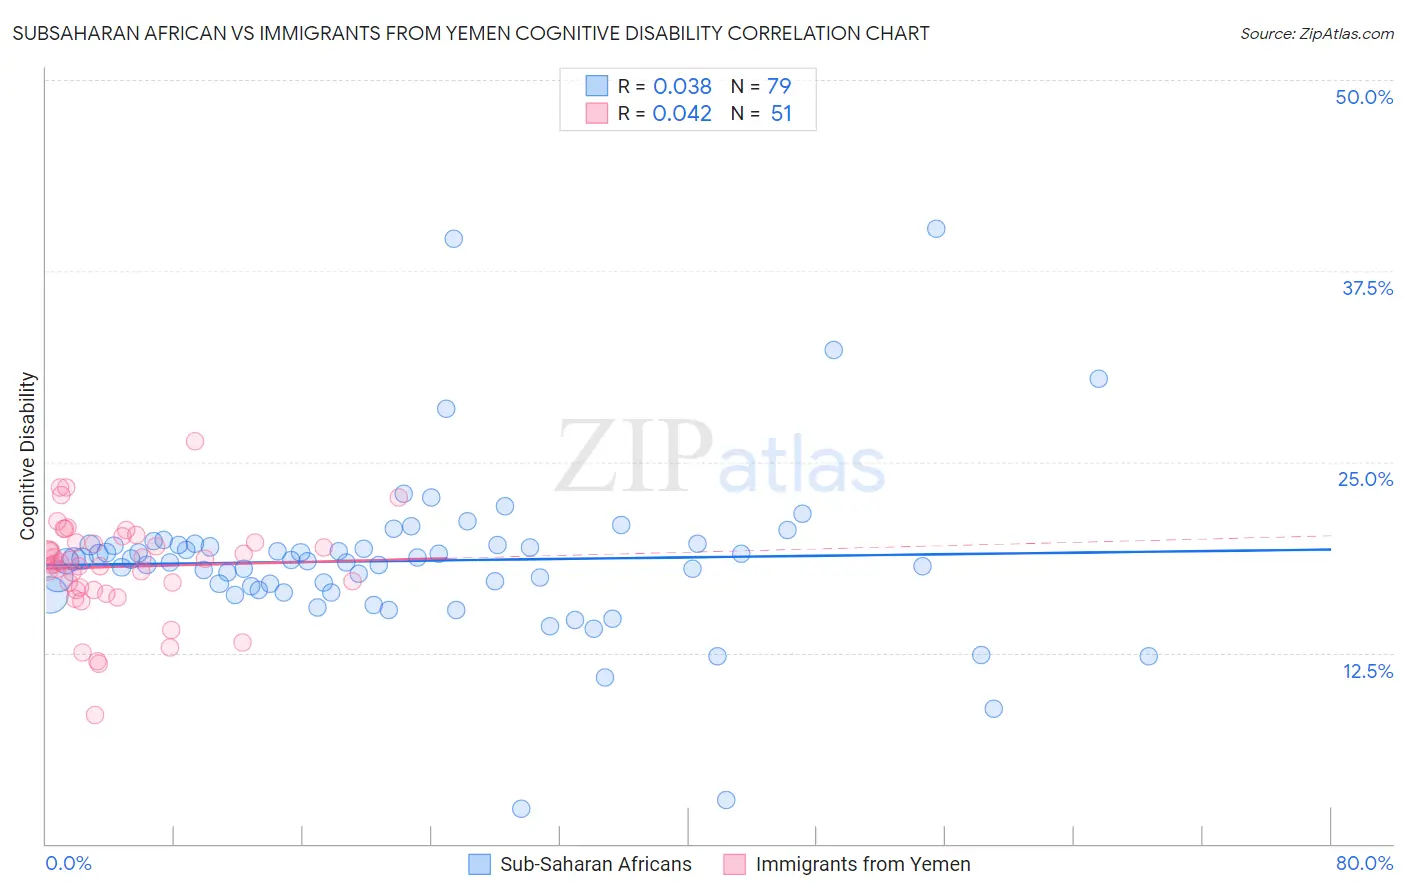
Subsaharan African vs Immigrants from Yemen Cognitive Disability Correlation Chart
The statistical analysis conducted on geographies consisting of 508,099,215 people shows no correlation between the proportion of Sub-Saharan Africans and percentage of population with cognitive disability in the United States with a correlation coefficient (R) of 0.038 and weighted average of 18.5%. Similarly, the statistical analysis conducted on geographies consisting of 82,433,611 people shows no correlation between the proportion of Immigrants from Yemen and percentage of population with cognitive disability in the United States with a correlation coefficient (R) of 0.042 and weighted average of 18.8%, a difference of 1.5%.
Cognitive Disability Correlation Summary
| Measurement | Subsaharan African | Immigrants from Yemen |
| Minimum | 2.3% | 8.4% |
| Maximum | 40.3% | 26.3% |
| Range | 38.0% | 17.9% |
| Mean | 18.5% | 18.1% |
| Median | 18.5% | 18.4% |
| Interquartile 25% (IQ1) | 16.6% | 16.6% |
| Interquartile 75% (IQ3) | 19.6% | 19.7% |
| Interquartile Range (IQR) | 2.9% | 3.1% |
| Standard Deviation (Sample) | 5.5% | 3.2% |
| Standard Deviation (Population) | 5.5% | 3.2% |
Demographics Similar to Sub-Saharan Africans and Immigrants from Yemen by Cognitive Disability
In terms of cognitive disability, the demographic groups most similar to Sub-Saharan Africans are Yaqui (18.5%, a difference of 0.060%), Immigrants from Dominica (18.6%, a difference of 0.18%), Immigrants from Middle Africa (18.6%, a difference of 0.26%), Liberian (18.6%, a difference of 0.34%), and Bangladeshi (18.6%, a difference of 0.46%). Similarly, the demographic groups most similar to Immigrants from Yemen are Immigrants from Sudan (18.8%, a difference of 0.060%), Pima (18.8%, a difference of 0.070%), Immigrants from Dominican Republic (18.8%, a difference of 0.14%), Navajo (18.8%, a difference of 0.24%), and Kiowa (18.7%, a difference of 0.46%).
| Demographics | Rating | Rank | Cognitive Disability |
| Yaqui | 0.0 /100 | #313 | Tragic 18.5% |
| Sub-Saharan Africans | 0.0 /100 | #314 | Tragic 18.5% |
| Immigrants | Dominica | 0.0 /100 | #315 | Tragic 18.6% |
| Immigrants | Middle Africa | 0.0 /100 | #316 | Tragic 18.6% |
| Liberians | 0.0 /100 | #317 | Tragic 18.6% |
| Bangladeshis | 0.0 /100 | #318 | Tragic 18.6% |
| Comanche | 0.0 /100 | #319 | Tragic 18.6% |
| Apache | 0.0 /100 | #320 | Tragic 18.6% |
| Africans | 0.0 /100 | #321 | Tragic 18.6% |
| Immigrants | Liberia | 0.0 /100 | #322 | Tragic 18.7% |
| Pueblo | 0.0 /100 | #323 | Tragic 18.7% |
| Dominicans | 0.0 /100 | #324 | Tragic 18.7% |
| Indonesians | 0.0 /100 | #325 | Tragic 18.7% |
| Immigrants | Senegal | 0.0 /100 | #326 | Tragic 18.7% |
| U.S. Virgin Islanders | 0.0 /100 | #327 | Tragic 18.7% |
| Kiowa | 0.0 /100 | #328 | Tragic 18.7% |
| Navajo | 0.0 /100 | #329 | Tragic 18.8% |
| Immigrants | Dominican Republic | 0.0 /100 | #330 | Tragic 18.8% |
| Pima | 0.0 /100 | #331 | Tragic 18.8% |
| Immigrants | Sudan | 0.0 /100 | #332 | Tragic 18.8% |
| Immigrants | Yemen | 0.0 /100 | #333 | Tragic 18.8% |