Slovak vs Immigrants from Honduras Ambulatory Disability
COMPARE
Slovak
Immigrants from Honduras
Ambulatory Disability
Ambulatory Disability Comparison
Slovaks
Immigrants from Honduras
6.7%
AMBULATORY DISABILITY
0.1/ 100
METRIC RATING
270th/ 347
METRIC RANK
6.3%
AMBULATORY DISABILITY
7.6/ 100
METRIC RATING
223rd/ 347
METRIC RANK
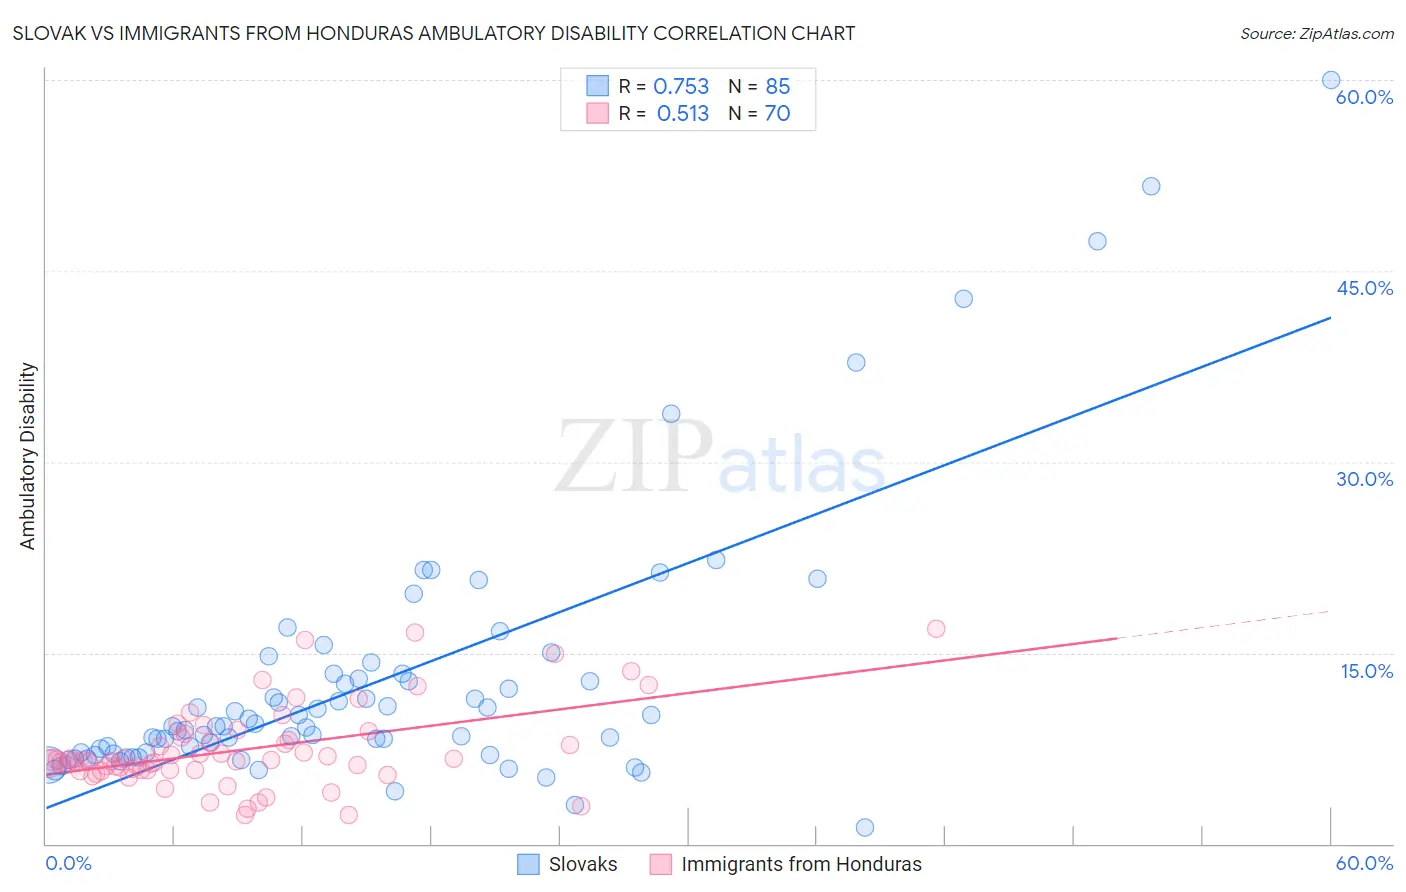
Slovak vs Immigrants from Honduras Ambulatory Disability Correlation Chart
The statistical analysis conducted on geographies consisting of 397,780,873 people shows a strong positive correlation between the proportion of Slovaks and percentage of population with ambulatory disability in the United States with a correlation coefficient (R) of 0.753 and weighted average of 6.7%. Similarly, the statistical analysis conducted on geographies consisting of 322,545,499 people shows a substantial positive correlation between the proportion of Immigrants from Honduras and percentage of population with ambulatory disability in the United States with a correlation coefficient (R) of 0.513 and weighted average of 6.3%, a difference of 5.4%.
Ambulatory Disability Correlation Summary
| Measurement | Slovak | Immigrants from Honduras |
| Minimum | 1.3% | 2.2% |
| Maximum | 60.0% | 16.9% |
| Range | 58.7% | 14.6% |
| Mean | 12.6% | 7.4% |
| Median | 9.2% | 6.5% |
| Interquartile 25% (IQ1) | 7.0% | 5.8% |
| Interquartile 75% (IQ3) | 13.2% | 8.3% |
| Interquartile Range (IQR) | 6.1% | 2.6% |
| Standard Deviation (Sample) | 10.4% | 3.2% |
| Standard Deviation (Population) | 10.3% | 3.2% |
Similar Demographics by Ambulatory Disability
Demographics Similar to Slovaks by Ambulatory Disability
In terms of ambulatory disability, the demographic groups most similar to Slovaks are Immigrants from Trinidad and Tobago (6.7%, a difference of 0.10%), French (6.6%, a difference of 0.16%), French Canadian (6.7%, a difference of 0.46%), Spanish (6.6%, a difference of 0.47%), and Trinidadian and Tobagonian (6.6%, a difference of 0.48%).
| Demographics | Rating | Rank | Ambulatory Disability |
| Hmong | 0.3 /100 | #263 | Tragic 6.6% |
| Nepalese | 0.2 /100 | #264 | Tragic 6.6% |
| Bahamians | 0.2 /100 | #265 | Tragic 6.6% |
| Guyanese | 0.2 /100 | #266 | Tragic 6.6% |
| Trinidadians and Tobagonians | 0.2 /100 | #267 | Tragic 6.6% |
| Spanish | 0.2 /100 | #268 | Tragic 6.6% |
| French | 0.1 /100 | #269 | Tragic 6.6% |
| Slovaks | 0.1 /100 | #270 | Tragic 6.7% |
| Immigrants | Trinidad and Tobago | 0.1 /100 | #271 | Tragic 6.7% |
| French Canadians | 0.1 /100 | #272 | Tragic 6.7% |
| Whites/Caucasians | 0.1 /100 | #273 | Tragic 6.7% |
| Sioux | 0.1 /100 | #274 | Tragic 6.7% |
| Immigrants | Guyana | 0.1 /100 | #275 | Tragic 6.7% |
| Celtics | 0.1 /100 | #276 | Tragic 6.7% |
| Jamaicans | 0.1 /100 | #277 | Tragic 6.7% |
Demographics Similar to Immigrants from Honduras by Ambulatory Disability
In terms of ambulatory disability, the demographic groups most similar to Immigrants from Honduras are Liberian (6.3%, a difference of 0.10%), Honduran (6.3%, a difference of 0.27%), German Russian (6.3%, a difference of 0.29%), Hungarian (6.3%, a difference of 0.32%), and Immigrants from Albania (6.3%, a difference of 0.33%).
| Demographics | Rating | Rank | Ambulatory Disability |
| Canadians | 10.9 /100 | #216 | Poor 6.3% |
| Yugoslavians | 10.9 /100 | #217 | Poor 6.3% |
| Guamanians/Chamorros | 10.6 /100 | #218 | Poor 6.3% |
| Indonesians | 9.9 /100 | #219 | Tragic 6.3% |
| Immigrants | Albania | 9.6 /100 | #220 | Tragic 6.3% |
| Hungarians | 9.6 /100 | #221 | Tragic 6.3% |
| German Russians | 9.4 /100 | #222 | Tragic 6.3% |
| Immigrants | Honduras | 7.6 /100 | #223 | Tragic 6.3% |
| Liberians | 7.1 /100 | #224 | Tragic 6.3% |
| Hondurans | 6.3 /100 | #225 | Tragic 6.3% |
| Slavs | 5.1 /100 | #226 | Tragic 6.4% |
| Cubans | 4.0 /100 | #227 | Tragic 6.4% |
| Portuguese | 4.0 /100 | #228 | Tragic 6.4% |
| Czechoslovakians | 3.8 /100 | #229 | Tragic 6.4% |
| Mexicans | 3.5 /100 | #230 | Tragic 6.4% |