Sioux vs Immigrants from Armenia Hearing Disability
COMPARE
Sioux
Immigrants from Armenia
Hearing Disability
Hearing Disability Comparison
Sioux
Immigrants from Armenia
3.6%
HEARING DISABILITY
0.0/ 100
METRIC RATING
285th/ 347
METRIC RANK
2.7%
HEARING DISABILITY
97.2/ 100
METRIC RATING
82nd/ 347
METRIC RANK
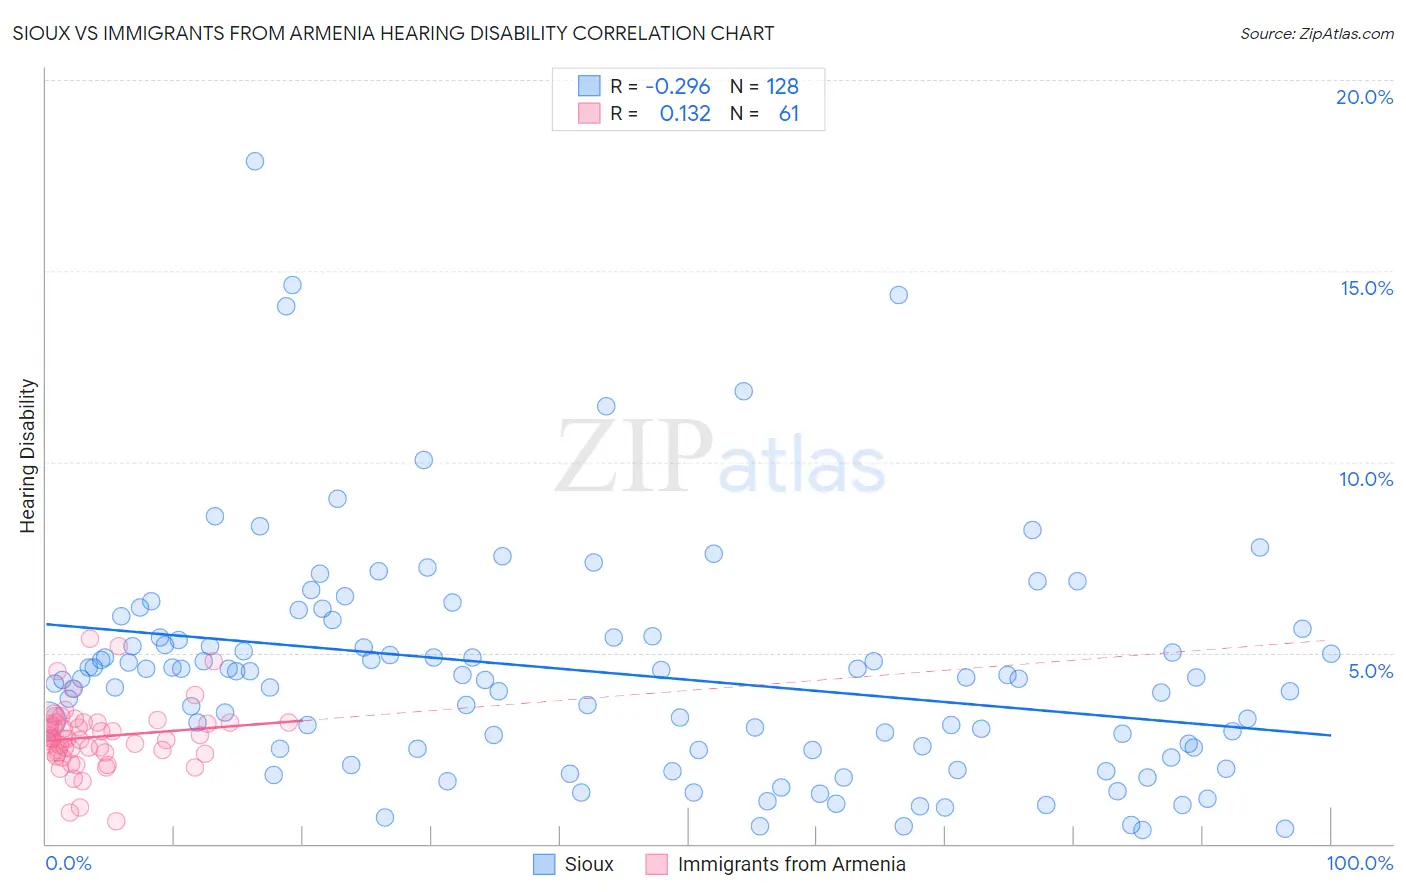
Sioux vs Immigrants from Armenia Hearing Disability Correlation Chart
The statistical analysis conducted on geographies consisting of 234,128,884 people shows a weak negative correlation between the proportion of Sioux and percentage of population with hearing disability in the United States with a correlation coefficient (R) of -0.296 and weighted average of 3.6%. Similarly, the statistical analysis conducted on geographies consisting of 97,707,768 people shows a poor positive correlation between the proportion of Immigrants from Armenia and percentage of population with hearing disability in the United States with a correlation coefficient (R) of 0.132 and weighted average of 2.7%, a difference of 32.6%.
Hearing Disability Correlation Summary
| Measurement | Sioux | Immigrants from Armenia |
| Minimum | 0.37% | 0.60% |
| Maximum | 17.9% | 5.4% |
| Range | 17.5% | 4.8% |
| Mean | 4.5% | 2.8% |
| Median | 4.3% | 2.8% |
| Interquartile 25% (IQ1) | 2.5% | 2.4% |
| Interquartile 75% (IQ3) | 5.4% | 3.2% |
| Interquartile Range (IQR) | 2.9% | 0.77% |
| Standard Deviation (Sample) | 3.0% | 0.87% |
| Standard Deviation (Population) | 3.0% | 0.86% |
Similar Demographics by Hearing Disability
Demographics Similar to Sioux by Hearing Disability
In terms of hearing disability, the demographic groups most similar to Sioux are Delaware (3.6%, a difference of 0.030%), Immigrants from Micronesia (3.6%, a difference of 0.10%), Spanish (3.7%, a difference of 0.28%), Blackfeet (3.6%, a difference of 0.57%), and Swedish (3.6%, a difference of 0.82%).
| Demographics | Rating | Rank | Hearing Disability |
| Basques | 0.0 /100 | #278 | Tragic 3.6% |
| Slovaks | 0.0 /100 | #279 | Tragic 3.6% |
| French American Indians | 0.0 /100 | #280 | Tragic 3.6% |
| Scandinavians | 0.0 /100 | #281 | Tragic 3.6% |
| Swedes | 0.0 /100 | #282 | Tragic 3.6% |
| Blackfeet | 0.0 /100 | #283 | Tragic 3.6% |
| Immigrants | Micronesia | 0.0 /100 | #284 | Tragic 3.6% |
| Sioux | 0.0 /100 | #285 | Tragic 3.6% |
| Delaware | 0.0 /100 | #286 | Tragic 3.6% |
| Spanish | 0.0 /100 | #287 | Tragic 3.7% |
| Irish | 0.0 /100 | #288 | Tragic 3.7% |
| Chinese | 0.0 /100 | #289 | Tragic 3.7% |
| Whites/Caucasians | 0.0 /100 | #290 | Tragic 3.7% |
| Finns | 0.0 /100 | #291 | Tragic 3.7% |
| Native Hawaiians | 0.0 /100 | #292 | Tragic 3.7% |
Demographics Similar to Immigrants from Armenia by Hearing Disability
In terms of hearing disability, the demographic groups most similar to Immigrants from Armenia are Immigrants from Uruguay (2.7%, a difference of 0.020%), Immigrants from Cuba (2.7%, a difference of 0.020%), Immigrants from Asia (2.7%, a difference of 0.050%), Immigrants from Argentina (2.8%, a difference of 0.21%), and Colombian (2.7%, a difference of 0.23%).
| Demographics | Rating | Rank | Hearing Disability |
| Immigrants | Saudi Arabia | 97.5 /100 | #75 | Exceptional 2.7% |
| Asians | 97.5 /100 | #76 | Exceptional 2.7% |
| Immigrants | Malaysia | 97.5 /100 | #77 | Exceptional 2.7% |
| Mongolians | 97.4 /100 | #78 | Exceptional 2.7% |
| Colombians | 97.4 /100 | #79 | Exceptional 2.7% |
| Immigrants | Asia | 97.2 /100 | #80 | Exceptional 2.7% |
| Immigrants | Uruguay | 97.2 /100 | #81 | Exceptional 2.7% |
| Immigrants | Armenia | 97.2 /100 | #82 | Exceptional 2.7% |
| Immigrants | Cuba | 97.2 /100 | #83 | Exceptional 2.7% |
| Immigrants | Argentina | 97.0 /100 | #84 | Exceptional 2.8% |
| Immigrants | Northern Africa | 96.9 /100 | #85 | Exceptional 2.8% |
| Immigrants | Iran | 96.8 /100 | #86 | Exceptional 2.8% |
| Somalis | 96.7 /100 | #87 | Exceptional 2.8% |
| Immigrants | Turkey | 96.7 /100 | #88 | Exceptional 2.8% |
| Belizeans | 96.6 /100 | #89 | Exceptional 2.8% |