Shoshone vs Canadian Cognitive Disability
COMPARE
Shoshone
Canadian
Cognitive Disability
Cognitive Disability Comparison
Shoshone
Canadians
17.3%
COGNITIVE DISABILITY
49.2/ 100
METRIC RATING
176th/ 347
METRIC RANK
16.8%
COGNITIVE DISABILITY
97.5/ 100
METRIC RATING
108th/ 347
METRIC RANK
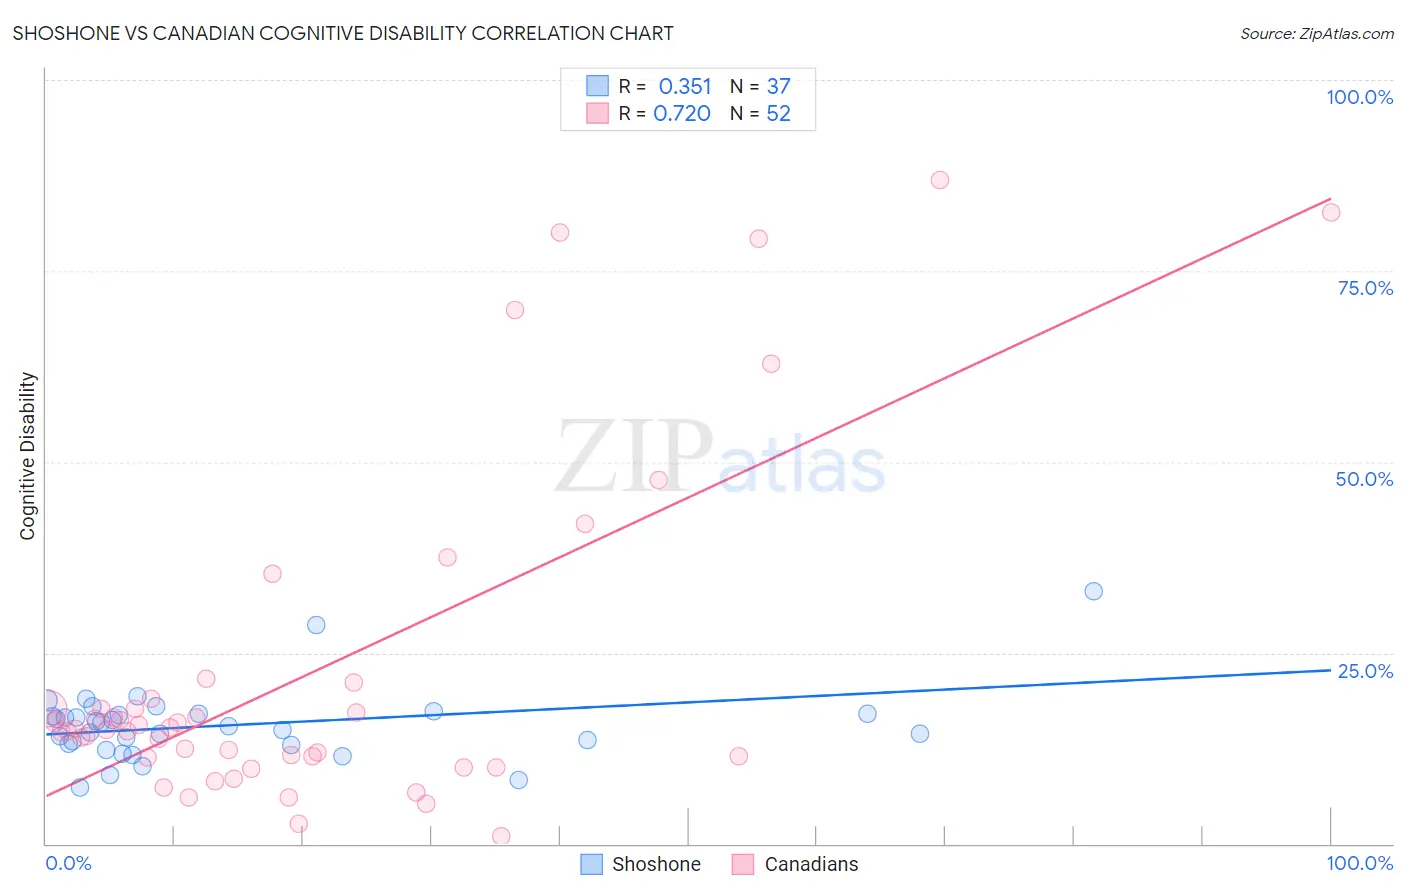
Shoshone vs Canadian Cognitive Disability Correlation Chart
The statistical analysis conducted on geographies consisting of 66,619,814 people shows a mild positive correlation between the proportion of Shoshone and percentage of population with cognitive disability in the United States with a correlation coefficient (R) of 0.351 and weighted average of 17.3%. Similarly, the statistical analysis conducted on geographies consisting of 437,506,516 people shows a strong positive correlation between the proportion of Canadians and percentage of population with cognitive disability in the United States with a correlation coefficient (R) of 0.720 and weighted average of 16.8%, a difference of 2.7%.
Cognitive Disability Correlation Summary
| Measurement | Shoshone | Canadian |
| Minimum | 7.4% | 1.0% |
| Maximum | 33.1% | 87.0% |
| Range | 25.7% | 85.9% |
| Mean | 15.5% | 22.4% |
| Median | 15.4% | 15.0% |
| Interquartile 25% (IQ1) | 13.0% | 11.3% |
| Interquartile 75% (IQ3) | 17.0% | 18.4% |
| Interquartile Range (IQR) | 4.0% | 7.1% |
| Standard Deviation (Sample) | 4.8% | 21.9% |
| Standard Deviation (Population) | 4.7% | 21.7% |
Similar Demographics by Cognitive Disability
Demographics Similar to Shoshone by Cognitive Disability
In terms of cognitive disability, the demographic groups most similar to Shoshone are Ute (17.3%, a difference of 0.0%), Spanish (17.3%, a difference of 0.010%), Laotian (17.3%, a difference of 0.020%), Tsimshian (17.3%, a difference of 0.020%), and Sioux (17.3%, a difference of 0.020%).
| Demographics | Rating | Rank | Cognitive Disability |
| Immigrants | Portugal | 61.8 /100 | #169 | Good 17.2% |
| Ecuadorians | 59.6 /100 | #170 | Average 17.2% |
| Tlingit-Haida | 59.4 /100 | #171 | Average 17.2% |
| Immigrants | Turkey | 56.7 /100 | #172 | Average 17.2% |
| Immigrants | Northern Africa | 50.2 /100 | #173 | Average 17.3% |
| Laotians | 50.0 /100 | #174 | Average 17.3% |
| Tsimshian | 49.8 /100 | #175 | Average 17.3% |
| Shoshone | 49.2 /100 | #176 | Average 17.3% |
| Ute | 49.1 /100 | #177 | Average 17.3% |
| Spanish | 48.9 /100 | #178 | Average 17.3% |
| Sioux | 48.6 /100 | #179 | Average 17.3% |
| Pakistanis | 43.9 /100 | #180 | Average 17.3% |
| Immigrants | Guyana | 42.9 /100 | #181 | Average 17.3% |
| Arabs | 42.8 /100 | #182 | Average 17.3% |
| Spaniards | 40.3 /100 | #183 | Average 17.3% |
Demographics Similar to Canadians by Cognitive Disability
In terms of cognitive disability, the demographic groups most similar to Canadians are Albanian (16.8%, a difference of 0.050%), Arapaho (16.8%, a difference of 0.060%), Uruguayan (16.8%, a difference of 0.070%), Immigrants from Nicaragua (16.8%, a difference of 0.090%), and Indian (Asian) (16.8%, a difference of 0.090%).
| Demographics | Rating | Rank | Cognitive Disability |
| Immigrants | Asia | 98.1 /100 | #101 | Exceptional 16.8% |
| Irish | 98.1 /100 | #102 | Exceptional 16.8% |
| Paraguayans | 98.0 /100 | #103 | Exceptional 16.8% |
| Palestinians | 98.0 /100 | #104 | Exceptional 16.8% |
| Immigrants | Eastern Asia | 97.9 /100 | #105 | Exceptional 16.8% |
| Northern Europeans | 97.8 /100 | #106 | Exceptional 16.8% |
| Immigrants | Nicaragua | 97.8 /100 | #107 | Exceptional 16.8% |
| Canadians | 97.5 /100 | #108 | Exceptional 16.8% |
| Albanians | 97.3 /100 | #109 | Exceptional 16.8% |
| Arapaho | 97.3 /100 | #110 | Exceptional 16.8% |
| Uruguayans | 97.2 /100 | #111 | Exceptional 16.8% |
| Indians (Asian) | 97.2 /100 | #112 | Exceptional 16.8% |
| Immigrants | Sri Lanka | 97.1 /100 | #113 | Exceptional 16.8% |
| Koreans | 97.1 /100 | #114 | Exceptional 16.8% |
| Yup'ik | 96.9 /100 | #115 | Exceptional 16.9% |