Pueblo vs Immigrants from Nigeria Hearing Disability
COMPARE
Pueblo
Immigrants from Nigeria
Hearing Disability
Hearing Disability Comparison
Pueblo
Immigrants from Nigeria
4.6%
HEARING DISABILITY
0.0/ 100
METRIC RATING
340th/ 347
METRIC RANK
2.6%
HEARING DISABILITY
99.8/ 100
METRIC RATING
23rd/ 347
METRIC RANK
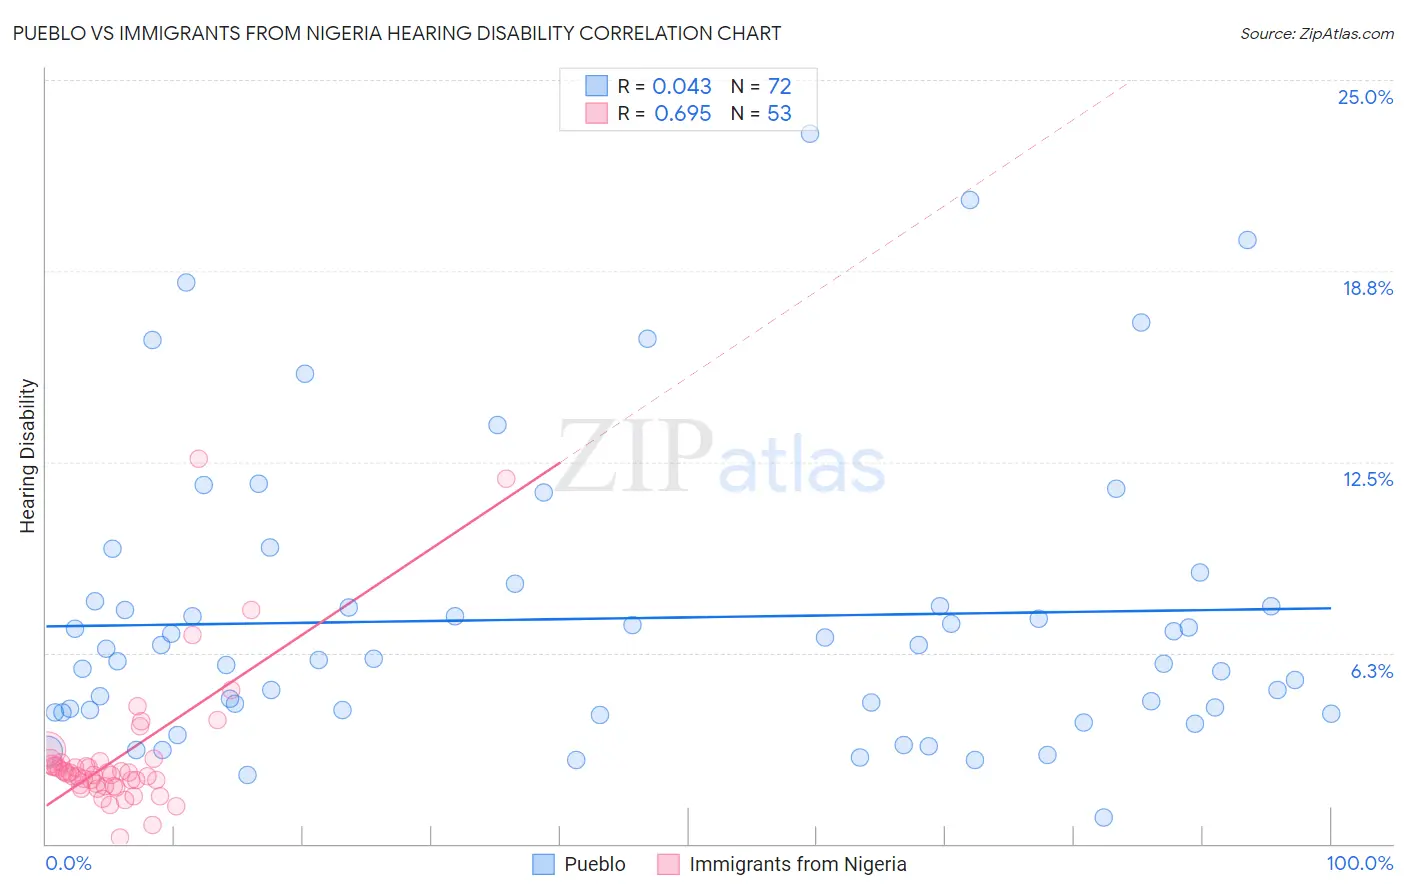
Pueblo vs Immigrants from Nigeria Hearing Disability Correlation Chart
The statistical analysis conducted on geographies consisting of 120,073,989 people shows no correlation between the proportion of Pueblo and percentage of population with hearing disability in the United States with a correlation coefficient (R) of 0.043 and weighted average of 4.6%. Similarly, the statistical analysis conducted on geographies consisting of 283,406,904 people shows a significant positive correlation between the proportion of Immigrants from Nigeria and percentage of population with hearing disability in the United States with a correlation coefficient (R) of 0.695 and weighted average of 2.6%, a difference of 80.1%.
Hearing Disability Correlation Summary
| Measurement | Pueblo | Immigrants from Nigeria |
| Minimum | 0.85% | 0.19% |
| Maximum | 23.2% | 12.6% |
| Range | 22.4% | 12.4% |
| Mean | 7.4% | 2.9% |
| Median | 6.0% | 2.3% |
| Interquartile 25% (IQ1) | 4.3% | 1.9% |
| Interquartile 75% (IQ3) | 7.8% | 2.7% |
| Interquartile Range (IQR) | 3.5% | 0.75% |
| Standard Deviation (Sample) | 4.7% | 2.3% |
| Standard Deviation (Population) | 4.7% | 2.2% |
Similar Demographics by Hearing Disability
Demographics Similar to Pueblo by Hearing Disability
In terms of hearing disability, the demographic groups most similar to Pueblo are Navajo (4.6%, a difference of 0.33%), Choctaw (4.5%, a difference of 1.5%), Tsimshian (4.7%, a difference of 1.9%), Inupiat (4.7%, a difference of 2.1%), and Alaska Native (4.5%, a difference of 2.9%).
| Demographics | Rating | Rank | Hearing Disability |
| Dutch West Indians | 0.0 /100 | #333 | Tragic 4.3% |
| Aleuts | 0.0 /100 | #334 | Tragic 4.3% |
| Kiowa | 0.0 /100 | #335 | Tragic 4.3% |
| Creek | 0.0 /100 | #336 | Tragic 4.4% |
| Chickasaw | 0.0 /100 | #337 | Tragic 4.5% |
| Alaska Natives | 0.0 /100 | #338 | Tragic 4.5% |
| Choctaw | 0.0 /100 | #339 | Tragic 4.5% |
| Pueblo | 0.0 /100 | #340 | Tragic 4.6% |
| Navajo | 0.0 /100 | #341 | Tragic 4.6% |
| Tsimshian | 0.0 /100 | #342 | Tragic 4.7% |
| Inupiat | 0.0 /100 | #343 | Tragic 4.7% |
| Tlingit-Haida | 0.0 /100 | #344 | Tragic 4.8% |
| Alaskan Athabascans | 0.0 /100 | #345 | Tragic 5.3% |
| Colville | 0.0 /100 | #346 | Tragic 5.3% |
| Yup'ik | 0.0 /100 | #347 | Tragic 5.8% |
Demographics Similar to Immigrants from Nigeria by Hearing Disability
In terms of hearing disability, the demographic groups most similar to Immigrants from Nigeria are Immigrants from Ghana (2.6%, a difference of 0.25%), Immigrants from Sierra Leone (2.6%, a difference of 0.50%), Ghanaian (2.5%, a difference of 0.54%), Immigrants from Bolivia (2.5%, a difference of 0.61%), and Thai (2.5%, a difference of 0.65%).
| Demographics | Rating | Rank | Hearing Disability |
| Immigrants | West Indies | 99.9 /100 | #16 | Exceptional 2.5% |
| Immigrants | India | 99.9 /100 | #17 | Exceptional 2.5% |
| Dominicans | 99.8 /100 | #18 | Exceptional 2.5% |
| Thais | 99.8 /100 | #19 | Exceptional 2.5% |
| Immigrants | Bolivia | 99.8 /100 | #20 | Exceptional 2.5% |
| Ghanaians | 99.8 /100 | #21 | Exceptional 2.5% |
| Immigrants | Sierra Leone | 99.8 /100 | #22 | Exceptional 2.6% |
| Immigrants | Nigeria | 99.8 /100 | #23 | Exceptional 2.6% |
| Immigrants | Ghana | 99.8 /100 | #24 | Exceptional 2.6% |
| Immigrants | El Salvador | 99.7 /100 | #25 | Exceptional 2.6% |
| Immigrants | Senegal | 99.7 /100 | #26 | Exceptional 2.6% |
| Immigrants | South Central Asia | 99.7 /100 | #27 | Exceptional 2.6% |
| Immigrants | Haiti | 99.7 /100 | #28 | Exceptional 2.6% |
| Bolivians | 99.7 /100 | #29 | Exceptional 2.6% |
| Immigrants | Caribbean | 99.7 /100 | #30 | Exceptional 2.6% |