Pueblo vs Immigrants from France Disability Age 35 to 64

COMPARE

Pueblo
Race
Ancestry
AfghanAfricanAlaska NativeAlaskan AthabascanAlbanianAleutAlsatianAmericanApacheArabArapahoArgentineanArmenianAssyrian/Chaldean/SyriacAustralianAustrianBahamianBangladeshiBarbadianBasqueBelgianBelizeanBermudanBhutaneseBlackfeetBolivianBrazilianBritishBritish West IndianBulgarianBurmeseCajunCambodianCanadianCape VerdeanCarpatho RusynCelticCentral AmericanCentral American IndianCherokeeCheyenneChickasawChileanChineseChippewaChoctawColombianColvilleComancheCosta RicanCreeCreekCroatianCrowCubanCypriotCzechCzechoslovakianDanishDelawareDominicanDutchDutch West IndianEastern EuropeanEcuadorianEgyptianEnglishEstonianEthiopianEuropeanFijianFilipinoFinnishFrenchFrench American IndianFrench CanadianGermanGerman RussianGhanaianGreekGuamanian/ChamorroGuatemalanGuyaneseHaitianHmongHonduranHopiHoumaHungarianIcelanderIndian (Asian)IndonesianInupiatIranianIraqiIrishIroquoisIsraeliItalianJamaicanJapaneseJordanianKenyanKiowaKoreanLaotianLatvianLebaneseLiberianLithuanianLumbeeLuxembourgerMacedonianMalaysianMalteseMarshalleseMenomineeMexicanMexican American IndianMongolianMoroccanNative HawaiianNavajoNepaleseNew ZealanderNicaraguanNigerianNorthern EuropeanNorwegianOkinawanOsageOttawaPaiutePakistaniPalestinianPanamanianParaguayanPennsylvania GermanPeruvianPimaPolishPortuguesePotawatomiPuebloPuerto RicanPuget Sound SalishRomanianRussianSalvadoranSamoanScandinavianScotch-IrishScottishSeminoleSenegaleseSerbianShoshoneSierra LeoneanSiouxSlavicSlovakSloveneSomaliSouth AfricanSouth AmericanSouth American IndianSoviet UnionSpaniardSpanishSpanish AmericanSpanish American IndianSri LankanSubsaharan AfricanSudaneseSwedishSwissSyrianTaiwaneseThaiTlingit-HaidaTohono O'OdhamTonganTrinidadian and TobagonianTsimshianTurkishU.S. Virgin IslanderUgandanUkrainianUruguayanUteVenezuelanVietnameseWelshWest IndianYakamaYaquiYugoslavianYumanYup'ikZimbabwean
Immigration
NonimmigrantsImmigrantsAfghanistanAfricaAlbaniaArgentinaArmeniaAsiaAustraliaAustriaBahamasBangladeshBarbadosBelarusBelgiumBelizeBoliviaBosnia and HerzegovinaBrazilBulgariaBurma/MyanmarCabo VerdeCambodiaCameroonCanadaCaribbeanCentral AmericaChileChinaColombiaCongoCosta RicaCroatiaCubaCzechoslovakiaDenmarkDominicaDominican RepublicEastern AfricaEastern AsiaEastern EuropeEcuadorEgyptEl SalvadorEnglandEritreaEthiopiaEuropeFijiGermanyGhanaGreeceGrenadaGuatemalaGuyanaHaitiHondurasHong KongHungaryIndiaIndonesiaIranIraqIrelandIsraelItalyJamaicaJapanJordanKazakhstanKenyaKoreaKuwaitLaosLatin AmericaLatviaLebanonLiberiaLithuaniaMalaysiaMexicoMicronesiaMiddle AfricaMoldovaMoroccoNepalNetherlandsNicaraguaNigeriaNorth AmericaNorth MacedoniaNorthern AfricaNorthern EuropeNorwayOceaniaPakistanPanamaPeruPhilippinesPolandPortugalRomaniaRussiaSaudi ArabiaScotlandSenegalSerbiaSierra LeoneSingaporeSomaliaSouth AfricaSouth AmericaSouth Central AsiaSouth Eastern AsiaSouthern EuropeSpainSri LankaSt. Vincent and the GrenadinesSudanSwedenSwitzerlandSyriaTaiwanThailandTrinidad and TobagoTurkeyUgandaUkraineUruguayUzbekistanVenezuelaVietnamWest IndiesWestern AfricaWestern AsiaWestern EuropeYemenZaireZimbabweAzores
Immigrants from France
Race
Ancestry
AfghanAfricanAlaska NativeAlaskan AthabascanAlbanianAleutAlsatianAmericanApacheArabArapahoArgentineanArmenianAssyrian/Chaldean/SyriacAustralianAustrianBahamianBangladeshiBarbadianBasqueBelgianBelizeanBermudanBhutaneseBlackfeetBolivianBrazilianBritishBritish West IndianBulgarianBurmeseCajunCambodianCanadianCape VerdeanCarpatho RusynCelticCentral AmericanCentral American IndianCherokeeCheyenneChickasawChileanChineseChippewaChoctawColombianColvilleComancheCosta RicanCreeCreekCroatianCrowCubanCypriotCzechCzechoslovakianDanishDelawareDominicanDutchDutch West IndianEastern EuropeanEcuadorianEgyptianEnglishEstonianEthiopianEuropeanFijianFilipinoFinnishFrenchFrench American IndianFrench CanadianGermanGerman RussianGhanaianGreekGuamanian/ChamorroGuatemalanGuyaneseHaitianHmongHonduranHopiHoumaHungarianIcelanderIndian (Asian)IndonesianInupiatIranianIraqiIrishIroquoisIsraeliItalianJamaicanJapaneseJordanianKenyanKiowaKoreanLaotianLatvianLebaneseLiberianLithuanianLumbeeLuxembourgerMacedonianMalaysianMalteseMarshalleseMenomineeMexicanMexican American IndianMongolianMoroccanNative HawaiianNavajoNepaleseNew ZealanderNicaraguanNigerianNorthern EuropeanNorwegianOkinawanOsageOttawaPaiutePakistaniPalestinianPanamanianParaguayanPennsylvania GermanPeruvianPimaPolishPortuguesePotawatomiPuerto RicanPuget Sound SalishRomanianRussianSalvadoranSamoanScandinavianScotch-IrishScottishSeminoleSenegaleseSerbianShoshoneSierra LeoneanSiouxSlavicSlovakSloveneSomaliSouth AfricanSouth AmericanSouth American IndianSoviet UnionSpaniardSpanishSpanish AmericanSpanish American IndianSri LankanSubsaharan AfricanSudaneseSwedishSwissSyrianTaiwaneseThaiTlingit-HaidaTohono O'OdhamTonganTrinidadian and TobagonianTsimshianTurkishU.S. Virgin IslanderUgandanUkrainianUruguayanUteVenezuelanVietnameseWelshWest IndianYakamaYaquiYugoslavianYumanYup'ikZimbabwean
Immigration
NonimmigrantsImmigrantsAfghanistanAfricaAlbaniaArgentinaArmeniaAsiaAustraliaAustriaBahamasBangladeshBarbadosBelarusBelgiumBelizeBoliviaBosnia and HerzegovinaBrazilBulgariaBurma/MyanmarCabo VerdeCambodiaCameroonCanadaCaribbeanCentral AmericaChileChinaColombiaCongoCosta RicaCroatiaCubaCzechoslovakiaDenmarkDominicaDominican RepublicEastern AfricaEastern AsiaEastern EuropeEcuadorEgyptEl SalvadorEnglandEritreaEthiopiaEuropeFijiFranceGermanyGhanaGreeceGrenadaGuatemalaGuyanaHaitiHondurasHong KongHungaryIndiaIndonesiaIranIraqIrelandIsraelItalyJamaicaJapanJordanKazakhstanKenyaKoreaKuwaitLaosLatin AmericaLatviaLebanonLiberiaLithuaniaMalaysiaMexicoMicronesiaMiddle AfricaMoldovaMoroccoNepalNetherlandsNicaraguaNigeriaNorth AmericaNorth MacedoniaNorthern AfricaNorthern EuropeNorwayOceaniaPakistanPanamaPeruPhilippinesPolandPortugalRomaniaRussiaSaudi ArabiaScotlandSenegalSerbiaSierra LeoneSingaporeSomaliaSouth AfricaSouth AmericaSouth Central AsiaSouth Eastern AsiaSouthern EuropeSpainSri LankaSt. Vincent and the GrenadinesSudanSwedenSwitzerlandSyriaTaiwanThailandTrinidad and TobagoTurkeyUgandaUkraineUruguayUzbekistanVenezuelaVietnamWest IndiesWestern AfricaWestern AsiaWestern EuropeYemenZaireZimbabweAzores
Disability Age 35 to 64
Income
Poverty
Unemployment
Labor Participation
Family Structure
Vehicle Availability
Education Level
Disability

Disability Age 35 to 64 Comparison

Pueblo

Immigrants from France

Tragic
Exceptional
15.3%
DISABILITY AGE 35 TO 64
0.0/ 100
METRIC RATING
327th/ 347
METRIC RANK
10.1%
DISABILITY AGE 35 TO 64
99.5/ 100
METRIC RATING
73rd/ 347
METRIC RANK

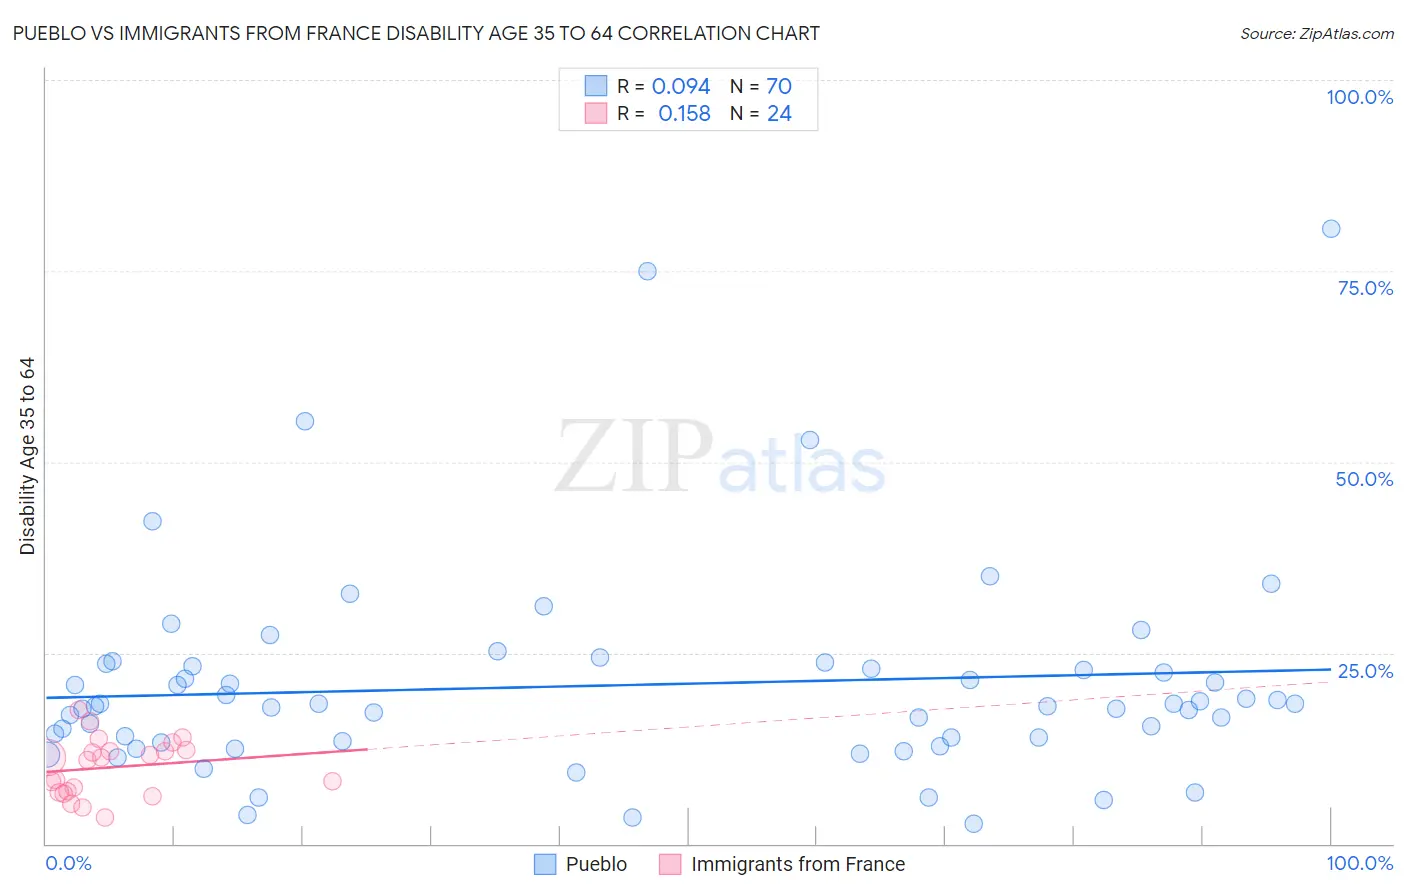
Pueblo vs Immigrants from France Disability Age 35 to 64 Correlation Chart

The statistical analysis conducted on geographies consisting of 120,065,944 people shows a slight positive correlation between the proportion of Pueblo and percentage of population with a disability between the ages 34 and 64 in the United States with a correlation coefficient (R) of 0.094 and weighted average of 15.3%. Similarly, the statistical analysis conducted on geographies consisting of 287,832,049 people shows a poor positive correlation between the proportion of Immigrants from France and percentage of population with a disability between the ages 34 and 64 in the United States with a correlation coefficient (R) of 0.158 and weighted average of 10.1%, a difference of 51.7%.
Pueblo vs Immigrants from France Disability Age 35 to 64

Disability Age 35 to 64 Correlation Summary

MeasurementPuebloImmigrants from France
Minimum2.7%3.5%
Maximum80.6%17.5%
Range77.9%14.0%
Mean20.7%10.0%
Median18.1%11.1%
Interquartile 25% (IQ1)13.5%6.8%
Interquartile 75% (IQ3)23.3%12.2%
Interquartile Range (IQR)9.8%5.4%
Standard Deviation (Sample)13.8%3.7%
Standard Deviation (Population)13.7%3.6%

Similar Demographics by Disability Age 35 to 64

Demographics Similar to Pueblo by Disability Age 35 to 64

In terms of disability age 35 to 64, the demographic groups most similar to Pueblo are Native/Alaskan (15.3%, a difference of 0.020%), Cajun (15.3%, a difference of 0.18%), Cherokee (15.5%, a difference of 0.93%), Navajo (15.5%, a difference of 1.1%), and Arapaho (15.1%, a difference of 1.7%).
DemographicsRating | RankDisability Age 35 to 64
Blacks/African Americans
0.0
/100
|
#320
Tragic
14.7%
Comanche
0.0
/100
|
#321
Tragic
14.7%
Potawatomi
0.0
/100
|
#322
Tragic
14.8%
Apache
0.0
/100
|
#323
Tragic
14.9%
Chippewa
0.0
/100
|
#324
Tragic
15.0%
Arapaho
0.0
/100
|
#325
Tragic
15.1%
Natives/Alaskans
0.0
/100
|
#326
Tragic
15.3%
Pueblo
0.0
/100
|
#327
Tragic
15.3%
Cajuns
0.0
/100
|
#328
Tragic
15.3%
Cherokee
0.0
/100
|
#329
Tragic
15.5%
Navajo
0.0
/100
|
#330
Tragic
15.5%
Dutch West Indians
0.0
/100
|
#331
Tragic
15.6%
Alaskan Athabascans
0.0
/100
|
#332
Tragic
15.7%
Yuman
0.0
/100
|
#333
Tragic
15.8%
Colville
0.0
/100
|
#334
Tragic
15.8%

Demographics Similar to Immigrants from France by Disability Age 35 to 64

In terms of disability age 35 to 64, the demographic groups most similar to Immigrants from France are Immigrants from Northern Europe (10.1%, a difference of 0.0%), Laotian (10.1%, a difference of 0.18%), Immigrants from Kazakhstan (10.1%, a difference of 0.20%), Immigrants from Nicaragua (10.1%, a difference of 0.21%), and Immigrants from Eastern Europe (10.1%, a difference of 0.23%).
DemographicsRating | RankDisability Age 35 to 64
Cubans
99.6
/100
|
#66
Exceptional
10.0%
Immigrants | Uzbekistan
99.5
/100
|
#67
Exceptional
10.1%
Immigrants | Switzerland
99.5
/100
|
#68
Exceptional
10.1%
Immigrants | Eastern Europe
99.5
/100
|
#69
Exceptional
10.1%
Immigrants | Nicaragua
99.5
/100
|
#70
Exceptional
10.1%
Immigrants | Kazakhstan
99.5
/100
|
#71
Exceptional
10.1%
Immigrants | Northern Europe
99.5
/100
|
#72
Exceptional
10.1%
Immigrants | France
99.5
/100
|
#73
Exceptional
10.1%
Laotians
99.4
/100
|
#74
Exceptional
10.1%
Immigrants | Latvia
99.4
/100
|
#75
Exceptional
10.1%
Immigrants | Chile
99.4
/100
|
#76
Exceptional
10.1%
Mongolians
99.4
/100
|
#77
Exceptional
10.1%
Jordanians
99.3
/100
|
#78
Exceptional
10.1%
Immigrants | Vietnam
99.3
/100
|
#79
Exceptional
10.1%
Immigrants | Croatia
99.3
/100
|
#80
Exceptional
10.2%