Portuguese vs Immigrants from Congo Disability Age 35 to 64
COMPARE
Portuguese
Immigrants from Congo
Disability Age 35 to 64
Disability Age 35 to 64 Comparison
Portuguese
Immigrants from Congo
11.9%
DISABILITY AGE 35 TO 64
4.9/ 100
METRIC RATING
234th/ 347
METRIC RANK
13.3%
DISABILITY AGE 35 TO 64
0.0/ 100
METRIC RATING
291st/ 347
METRIC RANK
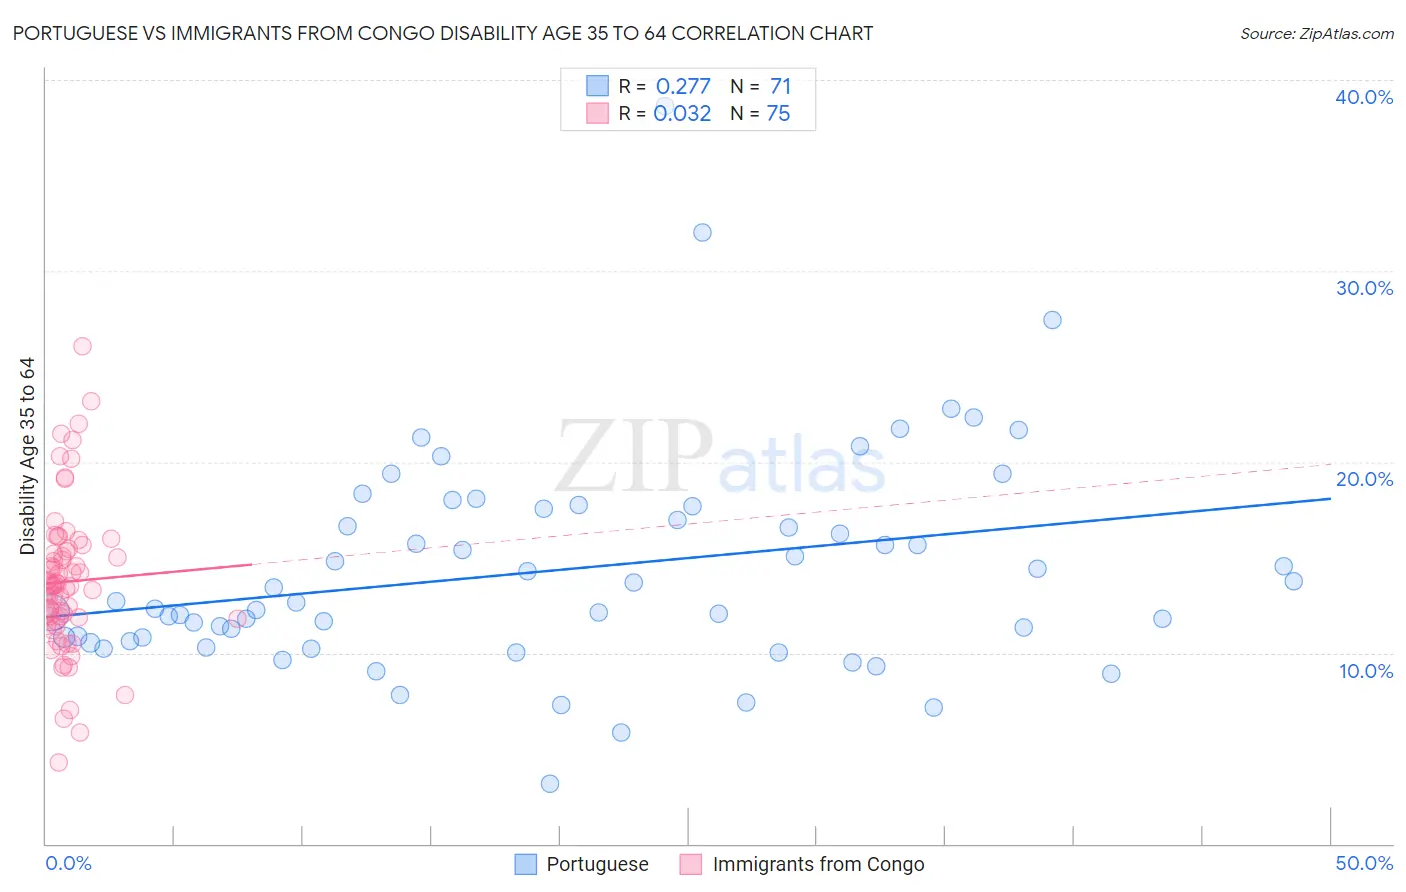
Portuguese vs Immigrants from Congo Disability Age 35 to 64 Correlation Chart
The statistical analysis conducted on geographies consisting of 449,875,842 people shows a weak positive correlation between the proportion of Portuguese and percentage of population with a disability between the ages 34 and 64 in the United States with a correlation coefficient (R) of 0.277 and weighted average of 11.9%. Similarly, the statistical analysis conducted on geographies consisting of 92,070,909 people shows no correlation between the proportion of Immigrants from Congo and percentage of population with a disability between the ages 34 and 64 in the United States with a correlation coefficient (R) of 0.032 and weighted average of 13.3%, a difference of 11.5%.
Disability Age 35 to 64 Correlation Summary
| Measurement | Portuguese | Immigrants from Congo |
| Minimum | 3.1% | 4.3% |
| Maximum | 38.6% | 26.1% |
| Range | 35.5% | 21.8% |
| Mean | 14.3% | 13.7% |
| Median | 12.7% | 13.5% |
| Interquartile 25% (IQ1) | 10.6% | 11.8% |
| Interquartile 75% (IQ3) | 17.6% | 15.3% |
| Interquartile Range (IQR) | 7.0% | 3.5% |
| Standard Deviation (Sample) | 5.8% | 3.9% |
| Standard Deviation (Population) | 5.8% | 3.8% |
Similar Demographics by Disability Age 35 to 64
Demographics Similar to Portuguese by Disability Age 35 to 64
In terms of disability age 35 to 64, the demographic groups most similar to Portuguese are Bermudan (11.9%, a difference of 0.070%), Belizean (12.0%, a difference of 0.13%), Immigrants from Middle Africa (12.0%, a difference of 0.15%), Sudanese (11.9%, a difference of 0.18%), and Jamaican (11.9%, a difference of 0.32%).
| Demographics | Rating | Rank | Disability Age 35 to 64 |
| Immigrants | Central America | 6.3 /100 | #227 | Tragic 11.9% |
| Immigrants | Germany | 6.2 /100 | #228 | Tragic 11.9% |
| British West Indians | 6.1 /100 | #229 | Tragic 11.9% |
| Panamanians | 5.8 /100 | #230 | Tragic 11.9% |
| Jamaicans | 5.7 /100 | #231 | Tragic 11.9% |
| Sudanese | 5.3 /100 | #232 | Tragic 11.9% |
| Bermudans | 5.0 /100 | #233 | Tragic 11.9% |
| Portuguese | 4.9 /100 | #234 | Tragic 11.9% |
| Belizeans | 4.5 /100 | #235 | Tragic 12.0% |
| Immigrants | Middle Africa | 4.5 /100 | #236 | Tragic 12.0% |
| Immigrants | Cambodia | 3.9 /100 | #237 | Tragic 12.0% |
| West Indians | 3.7 /100 | #238 | Tragic 12.0% |
| Immigrants | Western Africa | 3.3 /100 | #239 | Tragic 12.0% |
| Immigrants | Thailand | 3.3 /100 | #240 | Tragic 12.0% |
| Mexican American Indians | 3.2 /100 | #241 | Tragic 12.0% |
Demographics Similar to Immigrants from Congo by Disability Age 35 to 64
In terms of disability age 35 to 64, the demographic groups most similar to Immigrants from Congo are Puget Sound Salish (13.3%, a difference of 0.050%), Immigrants from Liberia (13.2%, a difference of 0.51%), Ute (13.4%, a difference of 0.52%), Indonesian (13.2%, a difference of 0.59%), and Fijian (13.2%, a difference of 0.66%).
| Demographics | Rating | Rank | Disability Age 35 to 64 |
| Immigrants | Nonimmigrants | 0.0 /100 | #284 | Tragic 13.0% |
| Immigrants | Somalia | 0.0 /100 | #285 | Tragic 13.1% |
| Hmong | 0.0 /100 | #286 | Tragic 13.1% |
| Tlingit-Haida | 0.0 /100 | #287 | Tragic 13.2% |
| Fijians | 0.0 /100 | #288 | Tragic 13.2% |
| Indonesians | 0.0 /100 | #289 | Tragic 13.2% |
| Immigrants | Liberia | 0.0 /100 | #290 | Tragic 13.2% |
| Immigrants | Congo | 0.0 /100 | #291 | Tragic 13.3% |
| Puget Sound Salish | 0.0 /100 | #292 | Tragic 13.3% |
| Ute | 0.0 /100 | #293 | Tragic 13.4% |
| Yaqui | 0.0 /100 | #294 | Tragic 13.5% |
| Yakama | 0.0 /100 | #295 | Tragic 13.6% |
| Africans | 0.0 /100 | #296 | Tragic 13.6% |
| Bangladeshis | 0.0 /100 | #297 | Tragic 13.6% |
| Cheyenne | 0.0 /100 | #298 | Tragic 13.6% |