Peruvian vs Immigrants from Western Asia Male Disability

COMPARE

Peruvian
Race
Ancestry
AfghanAfricanAlaska NativeAlaskan AthabascanAlbanianAleutAlsatianAmericanApacheArabArapahoArgentineanArmenianAssyrian/Chaldean/SyriacAustralianAustrianBahamianBangladeshiBarbadianBasqueBelgianBelizeanBermudanBhutaneseBlackfeetBolivianBrazilianBritishBritish West IndianBulgarianBurmeseCajunCambodianCanadianCape VerdeanCarpatho RusynCelticCentral AmericanCentral American IndianCherokeeCheyenneChickasawChileanChineseChippewaChoctawColombianColvilleComancheCosta RicanCreeCreekCroatianCrowCubanCypriotCzechCzechoslovakianDanishDelawareDominicanDutchDutch West IndianEastern EuropeanEcuadorianEgyptianEnglishEstonianEthiopianEuropeanFijianFilipinoFinnishFrenchFrench American IndianFrench CanadianGermanGerman RussianGhanaianGreekGuamanian/ChamorroGuatemalanGuyaneseHaitianHmongHonduranHopiHoumaHungarianIcelanderIndian (Asian)IndonesianInupiatIranianIraqiIrishIroquoisIsraeliItalianJamaicanJapaneseJordanianKenyanKiowaKoreanLaotianLatvianLebaneseLiberianLithuanianLumbeeLuxembourgerMacedonianMalaysianMalteseMarshalleseMenomineeMexicanMexican American IndianMongolianMoroccanNative HawaiianNavajoNepaleseNew ZealanderNicaraguanNigerianNorthern EuropeanNorwegianOkinawanOsageOttawaPaiutePakistaniPalestinianPanamanianParaguayanPennsylvania GermanPeruvianPimaPolishPortuguesePotawatomiPuebloPuerto RicanPuget Sound SalishRomanianRussianSalvadoranSamoanScandinavianScotch-IrishScottishSeminoleSenegaleseSerbianShoshoneSierra LeoneanSiouxSlavicSlovakSloveneSomaliSouth AfricanSouth AmericanSouth American IndianSoviet UnionSpaniardSpanishSpanish AmericanSpanish American IndianSri LankanSubsaharan AfricanSudaneseSwedishSwissSyrianTaiwaneseThaiTlingit-HaidaTohono O'OdhamTonganTrinidadian and TobagonianTsimshianTurkishU.S. Virgin IslanderUgandanUkrainianUruguayanUteVenezuelanVietnameseWelshWest IndianYakamaYaquiYugoslavianYumanYup'ikZimbabwean
Immigration
NonimmigrantsImmigrantsAfghanistanAfricaAlbaniaArgentinaArmeniaAsiaAustraliaAustriaBahamasBangladeshBarbadosBelarusBelgiumBelizeBoliviaBosnia and HerzegovinaBrazilBulgariaBurma/MyanmarCabo VerdeCambodiaCameroonCanadaCaribbeanCentral AmericaChileChinaColombiaCongoCosta RicaCroatiaCubaCzechoslovakiaDenmarkDominicaDominican RepublicEastern AfricaEastern AsiaEastern EuropeEcuadorEgyptEl SalvadorEnglandEritreaEthiopiaEuropeFijiFranceGermanyGhanaGreeceGrenadaGuatemalaGuyanaHaitiHondurasHong KongHungaryIndiaIndonesiaIranIraqIrelandIsraelItalyJamaicaJapanJordanKazakhstanKenyaKoreaKuwaitLaosLatin AmericaLatviaLebanonLiberiaLithuaniaMalaysiaMexicoMicronesiaMiddle AfricaMoldovaMoroccoNepalNetherlandsNicaraguaNigeriaNorth AmericaNorth MacedoniaNorthern AfricaNorthern EuropeNorwayOceaniaPakistanPanamaPeruPhilippinesPolandPortugalRomaniaRussiaSaudi ArabiaScotlandSenegalSerbiaSierra LeoneSingaporeSomaliaSouth AfricaSouth AmericaSouth Central AsiaSouth Eastern AsiaSouthern EuropeSpainSri LankaSt. Vincent and the GrenadinesSudanSwedenSwitzerlandSyriaTaiwanThailandTrinidad and TobagoTurkeyUgandaUkraineUruguayUzbekistanVenezuelaVietnamWest IndiesWestern AfricaWestern EuropeYemenZaireZimbabweAzores
Immigrants from Western Asia
Race
Ancestry
AfghanAfricanAlaska NativeAlaskan AthabascanAlbanianAleutAlsatianAmericanApacheArabArapahoArgentineanArmenianAssyrian/Chaldean/SyriacAustralianAustrianBahamianBangladeshiBarbadianBasqueBelgianBelizeanBermudanBhutaneseBlackfeetBolivianBrazilianBritishBritish West IndianBulgarianBurmeseCajunCambodianCanadianCape VerdeanCarpatho RusynCelticCentral AmericanCentral American IndianCherokeeCheyenneChickasawChileanChineseChippewaChoctawColombianColvilleComancheCosta RicanCreeCreekCroatianCrowCubanCypriotCzechCzechoslovakianDanishDelawareDominicanDutchDutch West IndianEastern EuropeanEcuadorianEgyptianEnglishEstonianEthiopianEuropeanFijianFilipinoFinnishFrenchFrench American IndianFrench CanadianGermanGerman RussianGhanaianGreekGuamanian/ChamorroGuatemalanGuyaneseHaitianHmongHonduranHopiHoumaHungarianIcelanderIndian (Asian)IndonesianInupiatIranianIraqiIrishIroquoisIsraeliItalianJamaicanJapaneseJordanianKenyanKiowaKoreanLaotianLatvianLebaneseLiberianLithuanianLumbeeLuxembourgerMacedonianMalaysianMalteseMarshalleseMenomineeMexicanMexican American IndianMongolianMoroccanNative HawaiianNavajoNepaleseNew ZealanderNicaraguanNigerianNorthern EuropeanNorwegianOkinawanOsageOttawaPaiutePakistaniPalestinianPanamanianParaguayanPennsylvania GermanPimaPolishPortuguesePotawatomiPuebloPuerto RicanPuget Sound SalishRomanianRussianSalvadoranSamoanScandinavianScotch-IrishScottishSeminoleSenegaleseSerbianShoshoneSierra LeoneanSiouxSlavicSlovakSloveneSomaliSouth AfricanSouth AmericanSouth American IndianSoviet UnionSpaniardSpanishSpanish AmericanSpanish American IndianSri LankanSubsaharan AfricanSudaneseSwedishSwissSyrianTaiwaneseThaiTlingit-HaidaTohono O'OdhamTonganTrinidadian and TobagonianTsimshianTurkishU.S. Virgin IslanderUgandanUkrainianUruguayanUteVenezuelanVietnameseWelshWest IndianYakamaYaquiYugoslavianYumanYup'ikZimbabwean
Immigration
NonimmigrantsImmigrantsAfghanistanAfricaAlbaniaArgentinaArmeniaAsiaAustraliaAustriaBahamasBangladeshBarbadosBelarusBelgiumBelizeBoliviaBosnia and HerzegovinaBrazilBulgariaBurma/MyanmarCabo VerdeCambodiaCameroonCanadaCaribbeanCentral AmericaChileChinaColombiaCongoCosta RicaCroatiaCubaCzechoslovakiaDenmarkDominicaDominican RepublicEastern AfricaEastern AsiaEastern EuropeEcuadorEgyptEl SalvadorEnglandEritreaEthiopiaEuropeFijiFranceGermanyGhanaGreeceGrenadaGuatemalaGuyanaHaitiHondurasHong KongHungaryIndiaIndonesiaIranIraqIrelandIsraelItalyJamaicaJapanJordanKazakhstanKenyaKoreaKuwaitLaosLatin AmericaLatviaLebanonLiberiaLithuaniaMalaysiaMexicoMicronesiaMiddle AfricaMoldovaMoroccoNepalNetherlandsNicaraguaNigeriaNorth AmericaNorth MacedoniaNorthern AfricaNorthern EuropeNorwayOceaniaPakistanPanamaPeruPhilippinesPolandPortugalRomaniaRussiaSaudi ArabiaScotlandSenegalSerbiaSierra LeoneSingaporeSomaliaSouth AfricaSouth AmericaSouth Central AsiaSouth Eastern AsiaSouthern EuropeSpainSri LankaSt. Vincent and the GrenadinesSudanSwedenSwitzerlandSyriaTaiwanThailandTrinidad and TobagoTurkeyUgandaUkraineUruguayUzbekistanVenezuelaVietnamWest IndiesWestern AfricaWestern AsiaWestern EuropeYemenZaireZimbabweAzores
Male Disability
Income
Poverty
Unemployment
Labor Participation
Family Structure
Vehicle Availability
Education Level
Disability

Male Disability Comparison

Peruvians

Immigrants from Western Asia

Exceptional
Exceptional
10.4%
MALE DISABILITY
99.6/ 100
METRIC RATING
54th/ 347
METRIC RANK
10.6%
MALE DISABILITY
97.8/ 100
METRIC RATING
88th/ 347
METRIC RANK

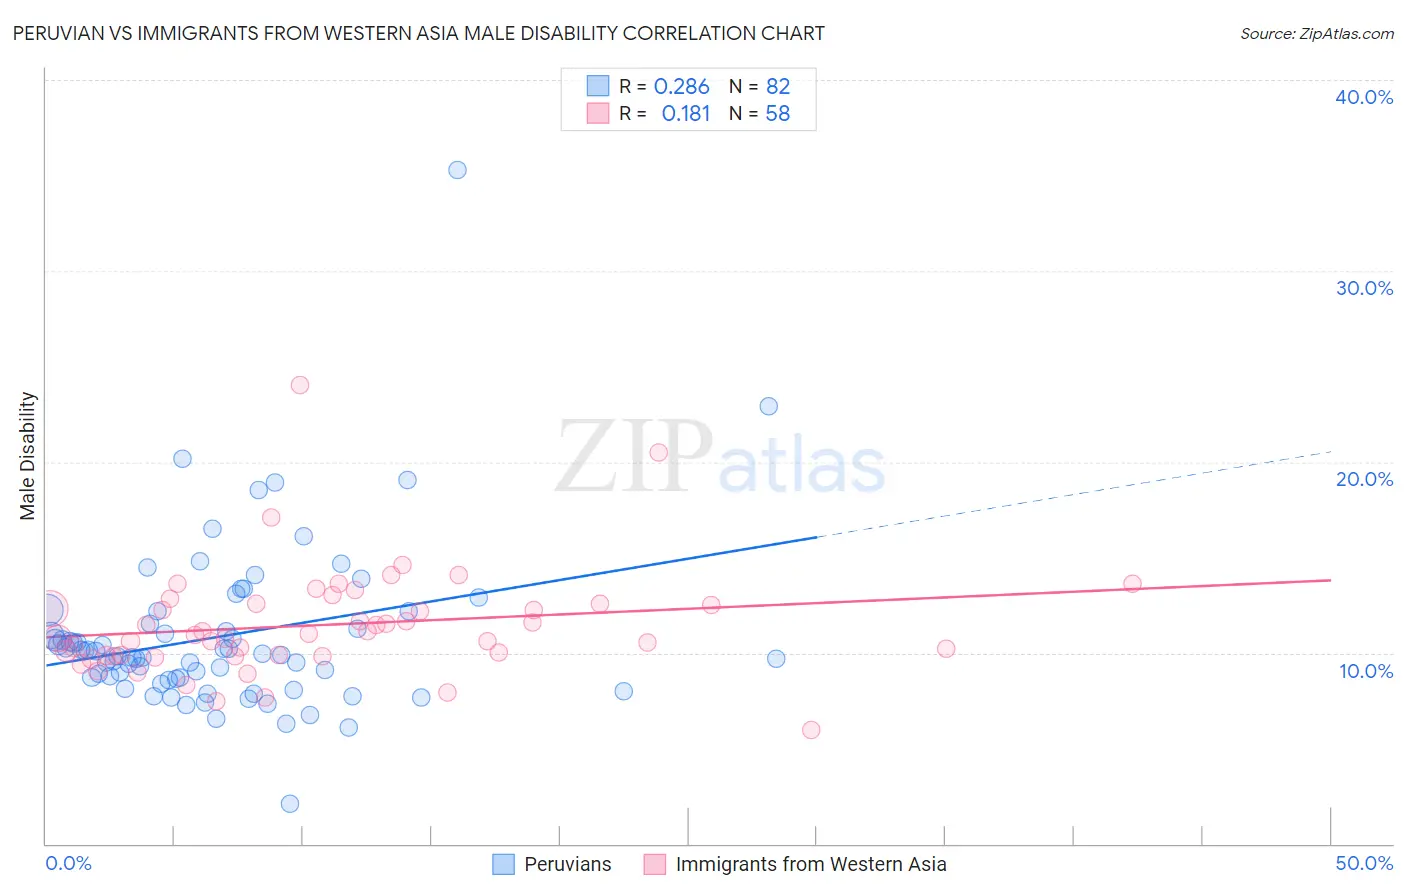
Peruvian vs Immigrants from Western Asia Male Disability Correlation Chart

The statistical analysis conducted on geographies consisting of 363,183,994 people shows a weak positive correlation between the proportion of Peruvians and percentage of males with a disability in the United States with a correlation coefficient (R) of 0.286 and weighted average of 10.4%. Similarly, the statistical analysis conducted on geographies consisting of 404,415,030 people shows a poor positive correlation between the proportion of Immigrants from Western Asia and percentage of males with a disability in the United States with a correlation coefficient (R) of 0.181 and weighted average of 10.6%, a difference of 2.5%.
Peruvian vs Immigrants from Western Asia Male Disability

Male Disability Correlation Summary

MeasurementPeruvianImmigrants from Western Asia
Minimum2.1%5.9%
Maximum35.3%24.0%
Range33.1%18.1%
Mean10.9%11.5%
Median9.9%11.0%
Interquartile 25% (IQ1)8.7%9.9%
Interquartile 75% (IQ3)11.5%12.6%
Interquartile Range (IQR)2.9%2.7%
Standard Deviation (Sample)4.3%2.9%
Standard Deviation (Population)4.3%2.8%

Similar Demographics by Male Disability

Demographics Similar to Peruvians by Male Disability

In terms of male disability, the demographic groups most similar to Peruvians are Immigrants from Eritrea (10.4%, a difference of 0.020%), Immigrants from Uzbekistan (10.4%, a difference of 0.040%), Immigrants from Saudi Arabia (10.4%, a difference of 0.060%), Tongan (10.4%, a difference of 0.060%), and Salvadoran (10.4%, a difference of 0.080%).
DemographicsRating | RankMale Disability
Immigrants | Peru
99.7
/100
|
#47
Exceptional
10.3%
Israelis
99.7
/100
|
#48
Exceptional
10.3%
Immigrants | Spain
99.7
/100
|
#49
Exceptional
10.3%
South Americans
99.6
/100
|
#50
Exceptional
10.3%
Salvadorans
99.6
/100
|
#51
Exceptional
10.4%
Immigrants | Saudi Arabia
99.6
/100
|
#52
Exceptional
10.4%
Immigrants | Uzbekistan
99.6
/100
|
#53
Exceptional
10.4%
Peruvians
99.6
/100
|
#54
Exceptional
10.4%
Immigrants | Eritrea
99.6
/100
|
#55
Exceptional
10.4%
Tongans
99.6
/100
|
#56
Exceptional
10.4%
Immigrants | South America
99.6
/100
|
#57
Exceptional
10.4%
Immigrants | Japan
99.5
/100
|
#58
Exceptional
10.4%
Immigrants | Australia
99.5
/100
|
#59
Exceptional
10.4%
Immigrants | Colombia
99.5
/100
|
#60
Exceptional
10.4%
Immigrants | Northern Africa
99.4
/100
|
#61
Exceptional
10.4%

Demographics Similar to Immigrants from Western Asia by Male Disability

In terms of male disability, the demographic groups most similar to Immigrants from Western Asia are Immigrants from Nicaragua (10.6%, a difference of 0.0%), Immigrants from Morocco (10.6%, a difference of 0.050%), Immigrants from Vietnam (10.6%, a difference of 0.070%), Immigrants from Ireland (10.6%, a difference of 0.090%), and Immigrants from France (10.6%, a difference of 0.090%).
DemographicsRating | RankMale Disability
Immigrants | Chile
98.3
/100
|
#81
Exceptional
10.6%
Immigrants | Guyana
98.2
/100
|
#82
Exceptional
10.6%
Immigrants | Poland
98.1
/100
|
#83
Exceptional
10.6%
Bulgarians
98.1
/100
|
#84
Exceptional
10.6%
Sri Lankans
97.9
/100
|
#85
Exceptional
10.6%
Immigrants | Ireland
97.9
/100
|
#86
Exceptional
10.6%
Immigrants | Vietnam
97.9
/100
|
#87
Exceptional
10.6%
Immigrants | Western Asia
97.8
/100
|
#88
Exceptional
10.6%
Immigrants | Nicaragua
97.8
/100
|
#89
Exceptional
10.6%
Immigrants | Morocco
97.7
/100
|
#90
Exceptional
10.6%
Immigrants | France
97.6
/100
|
#91
Exceptional
10.6%
Palestinians
97.4
/100
|
#92
Exceptional
10.7%
Immigrants | St. Vincent and the Grenadines
97.1
/100
|
#93
Exceptional
10.7%
Immigrants | Sweden
96.9
/100
|
#94
Exceptional
10.7%
Chileans
96.9
/100
|
#95
Exceptional
10.7%