Pennsylvania German vs Hawaiian Disability Age 35 to 64
COMPARE
Pennsylvania German
Hawaiian
Disability Age 35 to 64
Disability Age 35 to 64 Comparison
Pennsylvania Germans
Hawaiians
12.8%
DISABILITY AGE 35 TO 64
0.1/ 100
METRIC RATING
273rd/ 347
METRIC RANK
12.3%
DISABILITY AGE 35 TO 64
0.9/ 100
METRIC RATING
254th/ 347
METRIC RANK
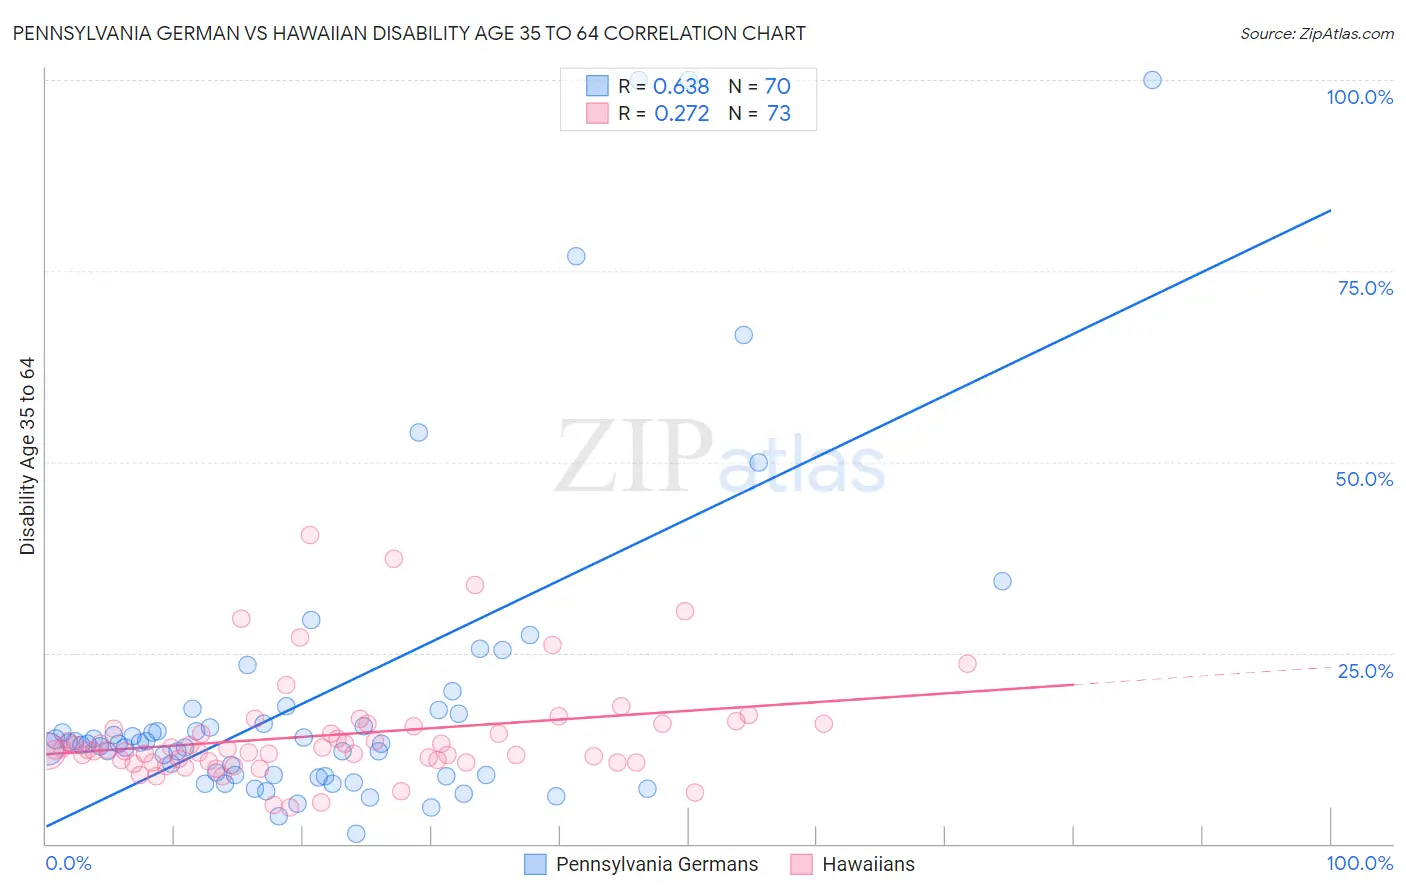
Pennsylvania German vs Hawaiian Disability Age 35 to 64 Correlation Chart
The statistical analysis conducted on geographies consisting of 234,029,546 people shows a significant positive correlation between the proportion of Pennsylvania Germans and percentage of population with a disability between the ages 34 and 64 in the United States with a correlation coefficient (R) of 0.638 and weighted average of 12.8%. Similarly, the statistical analysis conducted on geographies consisting of 327,340,087 people shows a weak positive correlation between the proportion of Hawaiians and percentage of population with a disability between the ages 34 and 64 in the United States with a correlation coefficient (R) of 0.272 and weighted average of 12.3%, a difference of 4.2%.
Disability Age 35 to 64 Correlation Summary
| Measurement | Pennsylvania German | Hawaiian |
| Minimum | 1.3% | 4.7% |
| Maximum | 100.0% | 40.5% |
| Range | 98.7% | 35.8% |
| Mean | 19.5% | 14.2% |
| Median | 13.1% | 12.3% |
| Interquartile 25% (IQ1) | 9.0% | 10.7% |
| Interquartile 75% (IQ3) | 16.9% | 15.5% |
| Interquartile Range (IQR) | 8.0% | 4.7% |
| Standard Deviation (Sample) | 21.6% | 6.8% |
| Standard Deviation (Population) | 21.4% | 6.8% |
Demographics Similar to Pennsylvania Germans and Hawaiians by Disability Age 35 to 64
In terms of disability age 35 to 64, the demographic groups most similar to Pennsylvania Germans are U.S. Virgin Islander (12.8%, a difference of 0.080%), Nepalese (12.8%, a difference of 0.21%), French (12.7%, a difference of 1.3%), Spanish (12.7%, a difference of 1.3%), and Immigrants from Dominica (12.7%, a difference of 1.4%). Similarly, the demographic groups most similar to Hawaiians are Dutch (12.3%, a difference of 0.11%), Japanese (12.3%, a difference of 0.13%), Scottish (12.4%, a difference of 0.30%), Mexican (12.4%, a difference of 0.56%), and Welsh (12.4%, a difference of 0.64%).
| Demographics | Rating | Rank | Disability Age 35 to 64 |
| Dutch | 1.0 /100 | #253 | Tragic 12.3% |
| Hawaiians | 0.9 /100 | #254 | Tragic 12.3% |
| Japanese | 0.8 /100 | #255 | Tragic 12.3% |
| Scottish | 0.8 /100 | #256 | Tragic 12.4% |
| Mexicans | 0.7 /100 | #257 | Tragic 12.4% |
| Welsh | 0.6 /100 | #258 | Tragic 12.4% |
| English | 0.6 /100 | #259 | Tragic 12.4% |
| German Russians | 0.5 /100 | #260 | Tragic 12.5% |
| Malaysians | 0.5 /100 | #261 | Tragic 12.5% |
| Senegalese | 0.5 /100 | #262 | Tragic 12.5% |
| Immigrants | Zaire | 0.4 /100 | #263 | Tragic 12.5% |
| Immigrants | Portugal | 0.4 /100 | #264 | Tragic 12.5% |
| Marshallese | 0.4 /100 | #265 | Tragic 12.5% |
| Whites/Caucasians | 0.3 /100 | #266 | Tragic 12.6% |
| Sub-Saharan Africans | 0.2 /100 | #267 | Tragic 12.6% |
| Immigrants | Dominica | 0.2 /100 | #268 | Tragic 12.7% |
| Spanish | 0.2 /100 | #269 | Tragic 12.7% |
| French | 0.2 /100 | #270 | Tragic 12.7% |
| Nepalese | 0.1 /100 | #271 | Tragic 12.8% |
| U.S. Virgin Islanders | 0.1 /100 | #272 | Tragic 12.8% |
| Pennsylvania Germans | 0.1 /100 | #273 | Tragic 12.8% |