Northern European vs Danish Cognitive Disability
COMPARE
Northern European
Danish
Cognitive Disability
Cognitive Disability Comparison
Northern Europeans
Danes
16.8%
COGNITIVE DISABILITY
97.8/ 100
METRIC RATING
106th/ 347
METRIC RANK
16.7%
COGNITIVE DISABILITY
98.8/ 100
METRIC RATING
91st/ 347
METRIC RANK
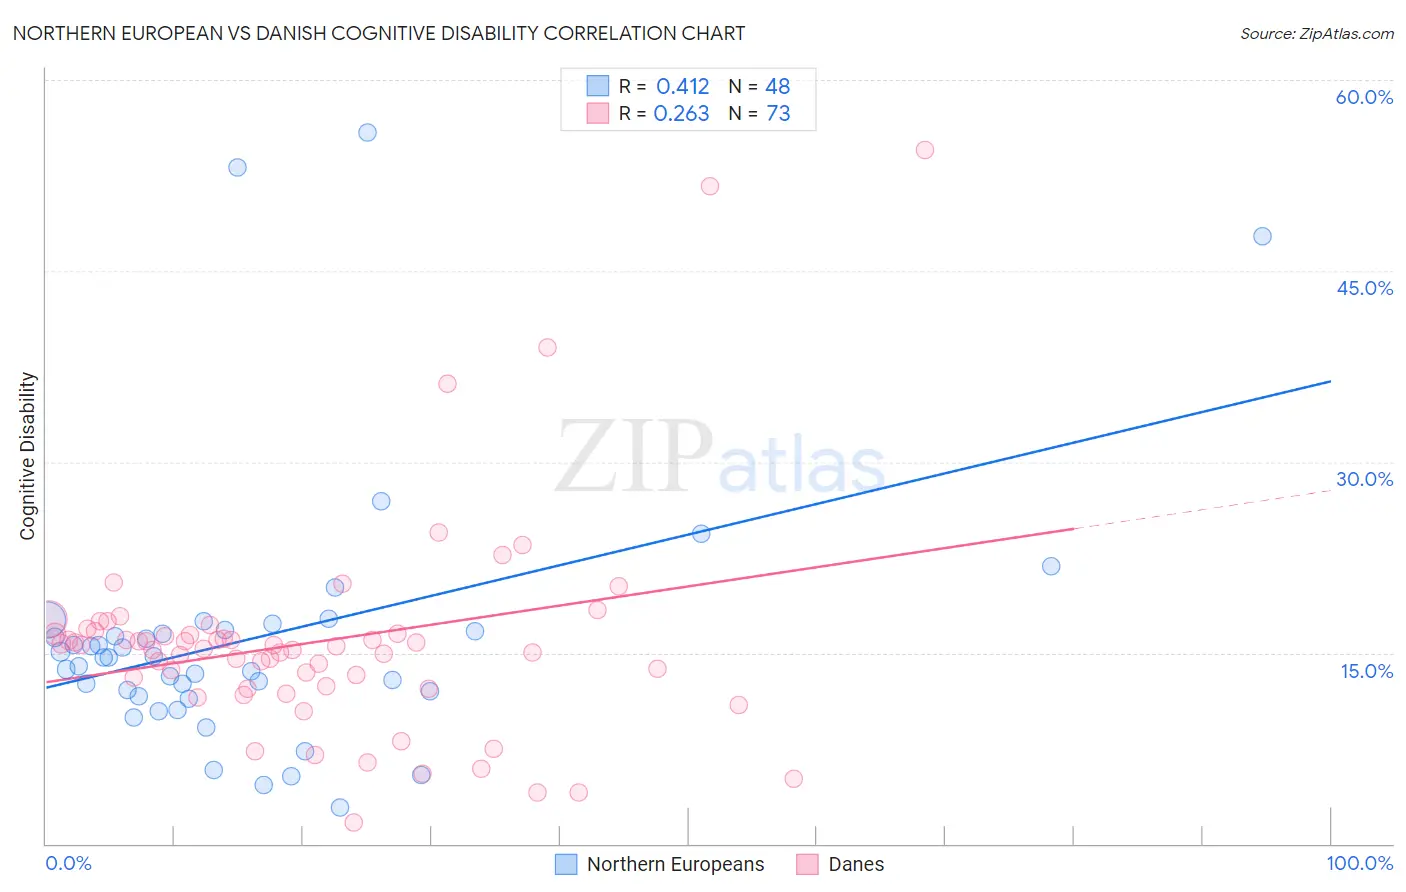
Northern European vs Danish Cognitive Disability Correlation Chart
The statistical analysis conducted on geographies consisting of 406,047,149 people shows a moderate positive correlation between the proportion of Northern Europeans and percentage of population with cognitive disability in the United States with a correlation coefficient (R) of 0.412 and weighted average of 16.8%. Similarly, the statistical analysis conducted on geographies consisting of 474,128,115 people shows a weak positive correlation between the proportion of Danes and percentage of population with cognitive disability in the United States with a correlation coefficient (R) of 0.263 and weighted average of 16.7%, a difference of 0.43%.
Cognitive Disability Correlation Summary
| Measurement | Northern European | Danish |
| Minimum | 2.8% | 1.7% |
| Maximum | 55.9% | 54.5% |
| Range | 53.1% | 52.9% |
| Mean | 16.2% | 15.8% |
| Median | 14.7% | 15.5% |
| Interquartile 25% (IQ1) | 11.8% | 12.3% |
| Interquartile 75% (IQ3) | 16.7% | 16.6% |
| Interquartile Range (IQR) | 4.9% | 4.3% |
| Standard Deviation (Sample) | 10.6% | 8.6% |
| Standard Deviation (Population) | 10.4% | 8.6% |
Demographics Similar to Northern Europeans and Danes by Cognitive Disability
In terms of cognitive disability, the demographic groups most similar to Northern Europeans are Immigrants from Nicaragua (16.8%, a difference of 0.020%), Immigrants from Eastern Asia (16.8%, a difference of 0.040%), Paraguayan (16.8%, a difference of 0.050%), Palestinian (16.8%, a difference of 0.050%), and Irish (16.8%, a difference of 0.090%). Similarly, the demographic groups most similar to Danes are Immigrants from Egypt (16.7%, a difference of 0.010%), South American (16.7%, a difference of 0.010%), Immigrants from South America (16.7%, a difference of 0.010%), Immigrants from Southern Europe (16.7%, a difference of 0.020%), and Asian (16.7%, a difference of 0.060%).
| Demographics | Rating | Rank | Cognitive Disability |
| Immigrants | Philippines | 99.0 /100 | #88 | Exceptional 16.7% |
| Immigrants | Egypt | 98.8 /100 | #89 | Exceptional 16.7% |
| South Americans | 98.8 /100 | #90 | Exceptional 16.7% |
| Danes | 98.8 /100 | #91 | Exceptional 16.7% |
| Immigrants | South America | 98.8 /100 | #92 | Exceptional 16.7% |
| Immigrants | Southern Europe | 98.7 /100 | #93 | Exceptional 16.7% |
| Asians | 98.7 /100 | #94 | Exceptional 16.7% |
| English | 98.6 /100 | #95 | Exceptional 16.8% |
| Finns | 98.5 /100 | #96 | Exceptional 16.8% |
| Dutch | 98.5 /100 | #97 | Exceptional 16.8% |
| Immigrants | Lebanon | 98.4 /100 | #98 | Exceptional 16.8% |
| Jordanians | 98.2 /100 | #99 | Exceptional 16.8% |
| Immigrants | Russia | 98.2 /100 | #100 | Exceptional 16.8% |
| Immigrants | Asia | 98.1 /100 | #101 | Exceptional 16.8% |
| Irish | 98.1 /100 | #102 | Exceptional 16.8% |
| Paraguayans | 98.0 /100 | #103 | Exceptional 16.8% |
| Palestinians | 98.0 /100 | #104 | Exceptional 16.8% |
| Immigrants | Eastern Asia | 97.9 /100 | #105 | Exceptional 16.8% |
| Northern Europeans | 97.8 /100 | #106 | Exceptional 16.8% |
| Immigrants | Nicaragua | 97.8 /100 | #107 | Exceptional 16.8% |
| Canadians | 97.5 /100 | #108 | Exceptional 16.8% |