Nonimmigrants vs Celtic Disability Age Over 75
COMPARE
Nonimmigrants
Celtic
Disability Age Over 75
Disability Age Over 75 Comparison
Nonimmigrants
Celtics
48.0%
DISABILITY AGE OVER 75
6.5/ 100
METRIC RATING
226th/ 347
METRIC RANK
47.2%
DISABILITY AGE OVER 75
58.7/ 100
METRIC RATING
169th/ 347
METRIC RANK
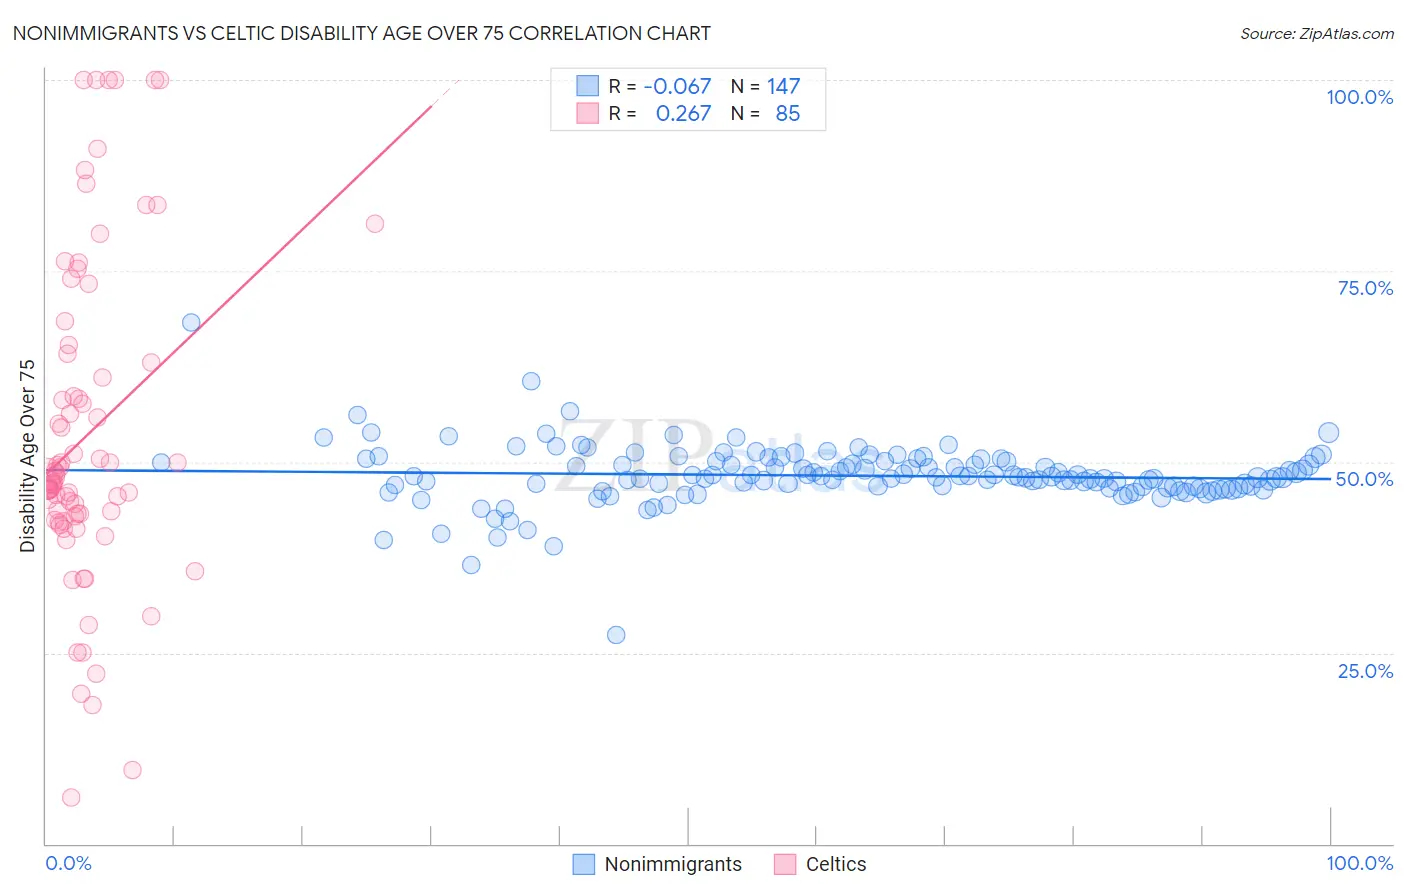
Nonimmigrants vs Celtic Disability Age Over 75 Correlation Chart
The statistical analysis conducted on geographies consisting of 582,018,698 people shows a slight negative correlation between the proportion of Nonimmigrants and percentage of population with a disability over the age of 75 in the United States with a correlation coefficient (R) of -0.067 and weighted average of 48.0%. Similarly, the statistical analysis conducted on geographies consisting of 168,767,238 people shows a weak positive correlation between the proportion of Celtics and percentage of population with a disability over the age of 75 in the United States with a correlation coefficient (R) of 0.267 and weighted average of 47.2%, a difference of 1.7%.
Disability Age Over 75 Correlation Summary
| Measurement | Nonimmigrants | Celtic |
| Minimum | 27.4% | 6.0% |
| Maximum | 68.2% | 100.0% |
| Range | 40.9% | 94.0% |
| Mean | 48.2% | 53.5% |
| Median | 47.9% | 47.6% |
| Interquartile 25% (IQ1) | 46.7% | 42.6% |
| Interquartile 75% (IQ3) | 50.0% | 63.6% |
| Interquartile Range (IQR) | 3.3% | 21.0% |
| Standard Deviation (Sample) | 4.0% | 21.1% |
| Standard Deviation (Population) | 4.0% | 21.0% |
Similar Demographics by Disability Age Over 75
Demographics Similar to Nonimmigrants by Disability Age Over 75
In terms of disability age over 75, the demographic groups most similar to Nonimmigrants are Spanish (48.0%, a difference of 0.010%), Zimbabwean (48.1%, a difference of 0.010%), Liberian (48.0%, a difference of 0.020%), Barbadian (48.0%, a difference of 0.030%), and Immigrants from Bangladesh (48.0%, a difference of 0.030%).
| Demographics | Rating | Rank | Disability Age Over 75 |
| Immigrants | Western Asia | 7.5 /100 | #219 | Tragic 48.0% |
| Bahamians | 7.4 /100 | #220 | Tragic 48.0% |
| Immigrants | Oceania | 7.3 /100 | #221 | Tragic 48.0% |
| Barbadians | 6.8 /100 | #222 | Tragic 48.0% |
| Immigrants | Bangladesh | 6.8 /100 | #223 | Tragic 48.0% |
| Liberians | 6.7 /100 | #224 | Tragic 48.0% |
| Spanish | 6.5 /100 | #225 | Tragic 48.0% |
| Immigrants | Nonimmigrants | 6.5 /100 | #226 | Tragic 48.0% |
| Zimbabweans | 6.4 /100 | #227 | Tragic 48.1% |
| Immigrants | Liberia | 5.9 /100 | #228 | Tragic 48.1% |
| Spaniards | 5.7 /100 | #229 | Tragic 48.1% |
| Taiwanese | 4.4 /100 | #230 | Tragic 48.2% |
| Immigrants | Immigrants | 4.3 /100 | #231 | Tragic 48.2% |
| Indonesians | 4.2 /100 | #232 | Tragic 48.2% |
| Cree | 4.2 /100 | #233 | Tragic 48.2% |
Demographics Similar to Celtics by Disability Age Over 75
In terms of disability age over 75, the demographic groups most similar to Celtics are Kenyan (47.2%, a difference of 0.0%), German Russian (47.3%, a difference of 0.060%), Moroccan (47.2%, a difference of 0.10%), Immigrants from Africa (47.3%, a difference of 0.12%), and Immigrants from Sierra Leone (47.2%, a difference of 0.13%).
| Demographics | Rating | Rank | Disability Age Over 75 |
| Pennsylvania Germans | 66.0 /100 | #162 | Good 47.2% |
| Immigrants | Eastern Africa | 65.5 /100 | #163 | Good 47.2% |
| French | 64.6 /100 | #164 | Good 47.2% |
| Immigrants | Zimbabwe | 64.4 /100 | #165 | Good 47.2% |
| Immigrants | Sierra Leone | 64.4 /100 | #166 | Good 47.2% |
| Moroccans | 62.9 /100 | #167 | Good 47.2% |
| Kenyans | 58.8 /100 | #168 | Average 47.2% |
| Celtics | 58.7 /100 | #169 | Average 47.2% |
| German Russians | 56.2 /100 | #170 | Average 47.3% |
| Immigrants | Africa | 53.6 /100 | #171 | Average 47.3% |
| Scotch-Irish | 52.5 /100 | #172 | Average 47.3% |
| Alsatians | 51.9 /100 | #173 | Average 47.3% |
| Whites/Caucasians | 50.0 /100 | #174 | Average 47.3% |
| Immigrants | Haiti | 49.7 /100 | #175 | Average 47.3% |
| Ecuadorians | 46.7 /100 | #176 | Average 47.4% |