Nepalese vs Estonian Disability Age Over 75

COMPARE

Nepalese
Race
Ancestry
AfghanAfricanAlaska NativeAlaskan AthabascanAlbanianAleutAlsatianAmericanApacheArabArapahoArgentineanArmenianAssyrian/Chaldean/SyriacAustralianAustrianBahamianBangladeshiBarbadianBasqueBelgianBelizeanBermudanBhutaneseBlackfeetBolivianBrazilianBritishBritish West IndianBulgarianBurmeseCajunCambodianCanadianCape VerdeanCarpatho RusynCelticCentral AmericanCentral American IndianCherokeeCheyenneChickasawChileanChineseChippewaChoctawColombianColvilleComancheCosta RicanCreeCreekCroatianCrowCubanCypriotCzechCzechoslovakianDanishDelawareDominicanDutchDutch West IndianEastern EuropeanEcuadorianEgyptianEnglishEthiopianEuropeanFijianFilipinoFinnishFrenchFrench American IndianFrench CanadianGermanGerman RussianGhanaianGreekGuamanian/ChamorroGuatemalanGuyaneseHaitianHmongHonduranHopiHoumaHungarianIcelanderIndian (Asian)IndonesianInupiatIranianIraqiIrishIroquoisIsraeliItalianJamaicanJapaneseJordanianKenyanKiowaKoreanLaotianLatvianLebaneseLiberianLithuanianLumbeeLuxembourgerMacedonianMalaysianMalteseMarshalleseMenomineeMexicanMexican American IndianMongolianMoroccanNative HawaiianNavajoNepaleseNew ZealanderNicaraguanNigerianNorthern EuropeanNorwegianOkinawanOsageOttawaPaiutePakistaniPalestinianPanamanianParaguayanPennsylvania GermanPeruvianPimaPolishPortuguesePotawatomiPuebloPuerto RicanPuget Sound SalishRomanianRussianSalvadoranSamoanScandinavianScotch-IrishScottishSeminoleSenegaleseSerbianShoshoneSierra LeoneanSiouxSlavicSlovakSloveneSomaliSouth AfricanSouth AmericanSouth American IndianSoviet UnionSpaniardSpanishSpanish AmericanSpanish American IndianSri LankanSubsaharan AfricanSudaneseSwedishSwissSyrianTaiwaneseThaiTlingit-HaidaTohono O'OdhamTonganTrinidadian and TobagonianTsimshianTurkishU.S. Virgin IslanderUgandanUkrainianUruguayanUteVenezuelanVietnameseWelshWest IndianYakamaYaquiYugoslavianYumanYup'ikZimbabwean
Immigration
NonimmigrantsImmigrantsAfghanistanAfricaAlbaniaArgentinaArmeniaAsiaAustraliaAustriaBahamasBangladeshBarbadosBelarusBelgiumBelizeBoliviaBosnia and HerzegovinaBrazilBulgariaBurma/MyanmarCabo VerdeCambodiaCameroonCanadaCaribbeanCentral AmericaChileChinaColombiaCongoCosta RicaCroatiaCubaCzechoslovakiaDenmarkDominicaDominican RepublicEastern AfricaEastern AsiaEastern EuropeEcuadorEgyptEl SalvadorEnglandEritreaEthiopiaEuropeFijiFranceGermanyGhanaGreeceGrenadaGuatemalaGuyanaHaitiHondurasHong KongHungaryIndiaIndonesiaIranIraqIrelandIsraelItalyJamaicaJapanJordanKazakhstanKenyaKoreaKuwaitLaosLatin AmericaLatviaLebanonLiberiaLithuaniaMalaysiaMexicoMicronesiaMiddle AfricaMoldovaMoroccoNepalNetherlandsNicaraguaNigeriaNorth AmericaNorth MacedoniaNorthern AfricaNorthern EuropeNorwayOceaniaPakistanPanamaPeruPhilippinesPolandPortugalRomaniaRussiaSaudi ArabiaScotlandSenegalSerbiaSierra LeoneSingaporeSomaliaSouth AfricaSouth AmericaSouth Central AsiaSouth Eastern AsiaSouthern EuropeSpainSri LankaSt. Vincent and the GrenadinesSudanSwedenSwitzerlandSyriaTaiwanThailandTrinidad and TobagoTurkeyUgandaUkraineUruguayUzbekistanVenezuelaVietnamWest IndiesWestern AfricaWestern AsiaWestern EuropeYemenZaireZimbabweAzores
Estonian
Race
Ancestry
AfghanAfricanAlaska NativeAlaskan AthabascanAlbanianAleutAlsatianAmericanApacheArabArapahoArgentineanArmenianAssyrian/Chaldean/SyriacAustralianAustrianBahamianBangladeshiBarbadianBasqueBelgianBelizeanBermudanBhutaneseBlackfeetBolivianBrazilianBritishBritish West IndianBulgarianBurmeseCajunCambodianCanadianCape VerdeanCarpatho RusynCelticCentral AmericanCentral American IndianCherokeeCheyenneChickasawChileanChineseChippewaChoctawColombianColvilleComancheCosta RicanCreeCreekCroatianCrowCubanCypriotCzechCzechoslovakianDanishDelawareDominicanDutchDutch West IndianEastern EuropeanEcuadorianEgyptianEnglishEstonianEthiopianEuropeanFijianFilipinoFinnishFrenchFrench American IndianFrench CanadianGermanGerman RussianGhanaianGreekGuamanian/ChamorroGuatemalanGuyaneseHaitianHmongHonduranHopiHoumaHungarianIcelanderIndian (Asian)IndonesianInupiatIranianIraqiIrishIroquoisIsraeliItalianJamaicanJapaneseJordanianKenyanKiowaKoreanLaotianLatvianLebaneseLiberianLithuanianLumbeeLuxembourgerMacedonianMalaysianMalteseMarshalleseMenomineeMexicanMexican American IndianMongolianMoroccanNative HawaiianNavajoNew ZealanderNicaraguanNigerianNorthern EuropeanNorwegianOkinawanOsageOttawaPaiutePakistaniPalestinianPanamanianParaguayanPennsylvania GermanPeruvianPimaPolishPortuguesePotawatomiPuebloPuerto RicanPuget Sound SalishRomanianRussianSalvadoranSamoanScandinavianScotch-IrishScottishSeminoleSenegaleseSerbianShoshoneSierra LeoneanSiouxSlavicSlovakSloveneSomaliSouth AfricanSouth AmericanSouth American IndianSoviet UnionSpaniardSpanishSpanish AmericanSpanish American IndianSri LankanSubsaharan AfricanSudaneseSwedishSwissSyrianTaiwaneseThaiTlingit-HaidaTohono O'OdhamTonganTrinidadian and TobagonianTsimshianTurkishU.S. Virgin IslanderUgandanUkrainianUruguayanUteVenezuelanVietnameseWelshWest IndianYakamaYaquiYugoslavianYumanYup'ikZimbabwean
Immigration
NonimmigrantsImmigrantsAfghanistanAfricaAlbaniaArgentinaArmeniaAsiaAustraliaAustriaBahamasBangladeshBarbadosBelarusBelgiumBelizeBoliviaBosnia and HerzegovinaBrazilBulgariaBurma/MyanmarCabo VerdeCambodiaCameroonCanadaCaribbeanCentral AmericaChileChinaColombiaCongoCosta RicaCroatiaCubaCzechoslovakiaDenmarkDominicaDominican RepublicEastern AfricaEastern AsiaEastern EuropeEcuadorEgyptEl SalvadorEnglandEritreaEthiopiaEuropeFijiFranceGermanyGhanaGreeceGrenadaGuatemalaGuyanaHaitiHondurasHong KongHungaryIndiaIndonesiaIranIraqIrelandIsraelItalyJamaicaJapanJordanKazakhstanKenyaKoreaKuwaitLaosLatin AmericaLatviaLebanonLiberiaLithuaniaMalaysiaMexicoMicronesiaMiddle AfricaMoldovaMoroccoNepalNetherlandsNicaraguaNigeriaNorth AmericaNorth MacedoniaNorthern AfricaNorthern EuropeNorwayOceaniaPakistanPanamaPeruPhilippinesPolandPortugalRomaniaRussiaSaudi ArabiaScotlandSenegalSerbiaSierra LeoneSingaporeSomaliaSouth AfricaSouth AmericaSouth Central AsiaSouth Eastern AsiaSouthern EuropeSpainSri LankaSt. Vincent and the GrenadinesSudanSwedenSwitzerlandSyriaTaiwanThailandTrinidad and TobagoTurkeyUgandaUkraineUruguayUzbekistanVenezuelaVietnamWest IndiesWestern AfricaWestern AsiaWestern EuropeYemenZaireZimbabweAzores
Disability Age Over 75
Income
Poverty
Unemployment
Labor Participation
Family Structure
Vehicle Availability
Education Level
Disability

Disability Age Over 75 Comparison

Nepalese

Estonians

Tragic
Exceptional
52.6%
DISABILITY AGE OVER 75
0.0/ 100
METRIC RATING
327th/ 347
METRIC RANK
45.6%
DISABILITY AGE OVER 75
99.9/ 100
METRIC RATING
39th/ 347
METRIC RANK

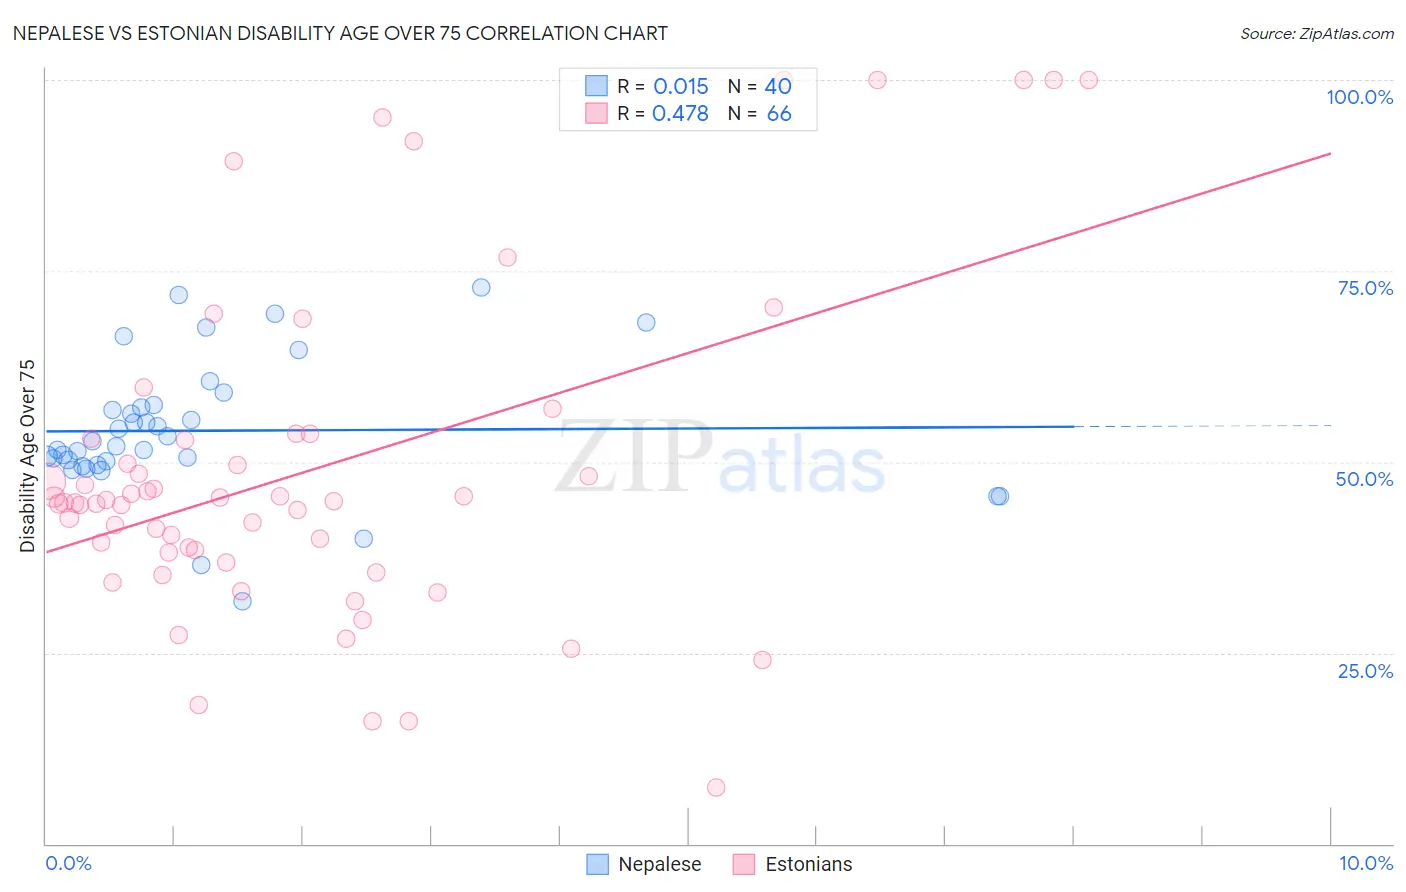
Nepalese vs Estonian Disability Age Over 75 Correlation Chart

The statistical analysis conducted on geographies consisting of 24,521,755 people shows no correlation between the proportion of Nepalese and percentage of population with a disability over the age of 75 in the United States with a correlation coefficient (R) of 0.015 and weighted average of 52.6%. Similarly, the statistical analysis conducted on geographies consisting of 123,486,929 people shows a moderate positive correlation between the proportion of Estonians and percentage of population with a disability over the age of 75 in the United States with a correlation coefficient (R) of 0.478 and weighted average of 45.6%, a difference of 15.3%.
Nepalese vs Estonian Disability Age Over 75

Disability Age Over 75 Correlation Summary

MeasurementNepaleseEstonian
Minimum31.7%7.4%
Maximum72.9%100.0%
Range41.1%92.6%
Mean54.1%49.0%
Median52.3%44.8%
Interquartile 25% (IQ1)49.8%38.1%
Interquartile 75% (IQ3)57.3%53.0%
Interquartile Range (IQR)7.5%14.9%
Standard Deviation (Sample)8.8%21.8%
Standard Deviation (Population)8.7%21.6%

Similar Demographics by Disability Age Over 75

Demographics Similar to Nepalese by Disability Age Over 75

In terms of disability age over 75, the demographic groups most similar to Nepalese are Ute (52.6%, a difference of 0.030%), Choctaw (52.7%, a difference of 0.19%), Immigrants from Cabo Verde (52.4%, a difference of 0.38%), Alaska Native (52.8%, a difference of 0.41%), and Menominee (52.3%, a difference of 0.54%).
DemographicsRating | RankDisability Age Over 75
Paiute
0.0
/100
|
#320
Tragic
51.5%
Dutch West Indians
0.0
/100
|
#321
Tragic
51.5%
Comanche
0.0
/100
|
#322
Tragic
51.7%
Immigrants | Yemen
0.0
/100
|
#323
Tragic
52.0%
Menominee
0.0
/100
|
#324
Tragic
52.3%
Immigrants | Cabo Verde
0.0
/100
|
#325
Tragic
52.4%
Ute
0.0
/100
|
#326
Tragic
52.6%
Nepalese
0.0
/100
|
#327
Tragic
52.6%
Choctaw
0.0
/100
|
#328
Tragic
52.7%
Alaska Natives
0.0
/100
|
#329
Tragic
52.8%
Puerto Ricans
0.0
/100
|
#330
Tragic
52.9%
Hopi
0.0
/100
|
#331
Tragic
52.9%
Natives/Alaskans
0.0
/100
|
#332
Tragic
53.1%
Apache
0.0
/100
|
#333
Tragic
53.6%
Alaskan Athabascans
0.0
/100
|
#334
Tragic
54.0%

Demographics Similar to Estonians by Disability Age Over 75

In terms of disability age over 75, the demographic groups most similar to Estonians are Italian (45.6%, a difference of 0.050%), Slovene (45.6%, a difference of 0.050%), Immigrants from Singapore (45.6%, a difference of 0.090%), Immigrants from Taiwan (45.5%, a difference of 0.11%), and South African (45.5%, a difference of 0.11%).
DemographicsRating | RankDisability Age Over 75
Immigrants | Australia
99.9
/100
|
#32
Exceptional
45.5%
Immigrants | Croatia
99.9
/100
|
#33
Exceptional
45.5%
Russians
99.9
/100
|
#34
Exceptional
45.5%
Norwegians
99.9
/100
|
#35
Exceptional
45.5%
Immigrants | Taiwan
99.9
/100
|
#36
Exceptional
45.5%
South Africans
99.9
/100
|
#37
Exceptional
45.5%
Italians
99.9
/100
|
#38
Exceptional
45.6%
Estonians
99.9
/100
|
#39
Exceptional
45.6%
Slovenes
99.9
/100
|
#40
Exceptional
45.6%
Immigrants | Singapore
99.8
/100
|
#41
Exceptional
45.6%
Greeks
99.8
/100
|
#42
Exceptional
45.6%
Czechs
99.8
/100
|
#43
Exceptional
45.7%
Australians
99.8
/100
|
#44
Exceptional
45.7%
Turks
99.8
/100
|
#45
Exceptional
45.7%
Swedes
99.8
/100
|
#46
Exceptional
45.7%