Native/Alaskan vs Finnish Disability Age Over 75
COMPARE
Native/Alaskan
Finnish
Disability Age Over 75
Disability Age Over 75 Comparison
Natives/Alaskans
Finns
53.1%
DISABILITY AGE OVER 75
0.0/ 100
METRIC RATING
332nd/ 347
METRIC RANK
46.3%
DISABILITY AGE OVER 75
97.9/ 100
METRIC RATING
97th/ 347
METRIC RANK
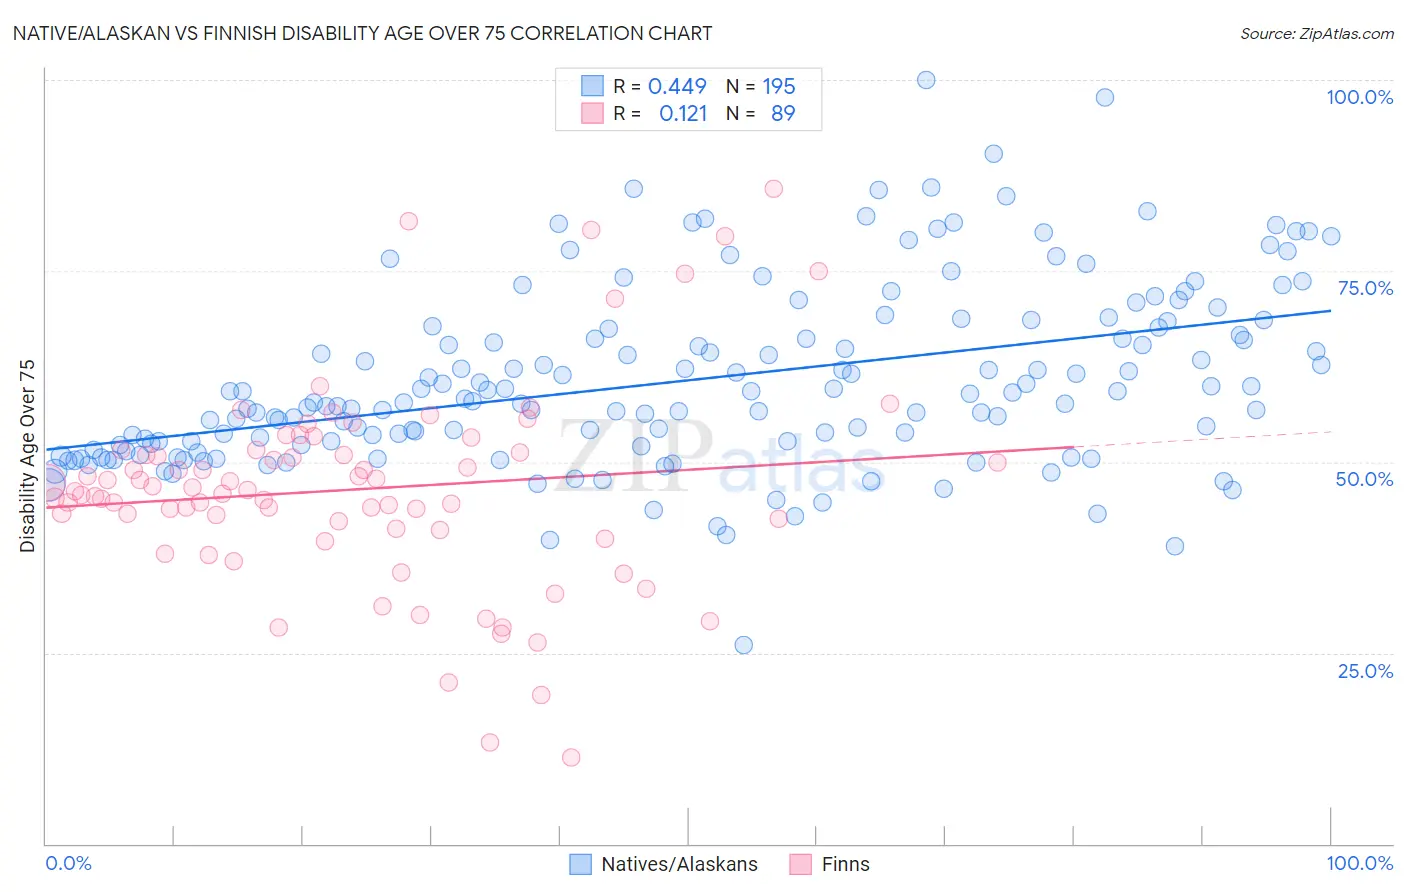
Native/Alaskan vs Finnish Disability Age Over 75 Correlation Chart
The statistical analysis conducted on geographies consisting of 511,593,286 people shows a moderate positive correlation between the proportion of Natives/Alaskans and percentage of population with a disability over the age of 75 in the United States with a correlation coefficient (R) of 0.449 and weighted average of 53.1%. Similarly, the statistical analysis conducted on geographies consisting of 404,104,832 people shows a poor positive correlation between the proportion of Finns and percentage of population with a disability over the age of 75 in the United States with a correlation coefficient (R) of 0.121 and weighted average of 46.3%, a difference of 14.5%.
Disability Age Over 75 Correlation Summary
| Measurement | Native/Alaskan | Finnish |
| Minimum | 26.0% | 11.3% |
| Maximum | 100.0% | 85.7% |
| Range | 74.0% | 74.4% |
| Mean | 60.6% | 46.4% |
| Median | 57.9% | 46.1% |
| Interquartile 25% (IQ1) | 52.1% | 41.1% |
| Interquartile 75% (IQ3) | 67.5% | 51.3% |
| Interquartile Range (IQR) | 15.4% | 10.2% |
| Standard Deviation (Sample) | 11.8% | 13.5% |
| Standard Deviation (Population) | 11.8% | 13.4% |
Similar Demographics by Disability Age Over 75
Demographics Similar to Natives/Alaskans by Disability Age Over 75
In terms of disability age over 75, the demographic groups most similar to Natives/Alaskans are Hopi (52.9%, a difference of 0.29%), Puerto Rican (52.9%, a difference of 0.31%), Alaska Native (52.8%, a difference of 0.49%), Choctaw (52.7%, a difference of 0.70%), and Nepalese (52.6%, a difference of 0.89%).
| Demographics | Rating | Rank | Disability Age Over 75 |
| Immigrants | Cabo Verde | 0.0 /100 | #325 | Tragic 52.4% |
| Ute | 0.0 /100 | #326 | Tragic 52.6% |
| Nepalese | 0.0 /100 | #327 | Tragic 52.6% |
| Choctaw | 0.0 /100 | #328 | Tragic 52.7% |
| Alaska Natives | 0.0 /100 | #329 | Tragic 52.8% |
| Puerto Ricans | 0.0 /100 | #330 | Tragic 52.9% |
| Hopi | 0.0 /100 | #331 | Tragic 52.9% |
| Natives/Alaskans | 0.0 /100 | #332 | Tragic 53.1% |
| Apache | 0.0 /100 | #333 | Tragic 53.6% |
| Alaskan Athabascans | 0.0 /100 | #334 | Tragic 54.0% |
| Kiowa | 0.0 /100 | #335 | Tragic 54.2% |
| Immigrants | Armenia | 0.0 /100 | #336 | Tragic 54.3% |
| Yuman | 0.0 /100 | #337 | Tragic 54.4% |
| Colville | 0.0 /100 | #338 | Tragic 55.4% |
| Pima | 0.0 /100 | #339 | Tragic 55.8% |
Demographics Similar to Finns by Disability Age Over 75
In terms of disability age over 75, the demographic groups most similar to Finns are Immigrants from Japan (46.3%, a difference of 0.010%), Immigrants from China (46.3%, a difference of 0.020%), Immigrants from Brazil (46.3%, a difference of 0.030%), Albanian (46.3%, a difference of 0.050%), and Palestinian (46.3%, a difference of 0.050%).
| Demographics | Rating | Rank | Disability Age Over 75 |
| Northern Europeans | 98.3 /100 | #90 | Exceptional 46.3% |
| Immigrants | Egypt | 98.3 /100 | #91 | Exceptional 46.3% |
| Germans | 98.2 /100 | #92 | Exceptional 46.3% |
| Ugandans | 98.2 /100 | #93 | Exceptional 46.3% |
| Albanians | 98.1 /100 | #94 | Exceptional 46.3% |
| Immigrants | Brazil | 98.0 /100 | #95 | Exceptional 46.3% |
| Immigrants | China | 98.0 /100 | #96 | Exceptional 46.3% |
| Finns | 97.9 /100 | #97 | Exceptional 46.3% |
| Immigrants | Japan | 97.8 /100 | #98 | Exceptional 46.3% |
| Palestinians | 97.7 /100 | #99 | Exceptional 46.3% |
| Immigrants | Eastern Europe | 97.7 /100 | #100 | Exceptional 46.3% |
| Mongolians | 97.7 /100 | #101 | Exceptional 46.3% |
| Immigrants | Malaysia | 97.1 /100 | #102 | Exceptional 46.4% |
| Ukrainians | 97.1 /100 | #103 | Exceptional 46.4% |
| Israelis | 97.0 /100 | #104 | Exceptional 46.4% |