Native Hawaiian vs Spanish Disability Age 18 to 34
COMPARE
Native Hawaiian
Spanish
Disability Age 18 to 34
Disability Age 18 to 34 Comparison
Native Hawaiians
Spanish
6.6%
DISABILITY AGE 18 TO 34
50.0/ 100
METRIC RATING
174th/ 347
METRIC RANK
7.5%
DISABILITY AGE 18 TO 34
0.0/ 100
METRIC RATING
282nd/ 347
METRIC RANK
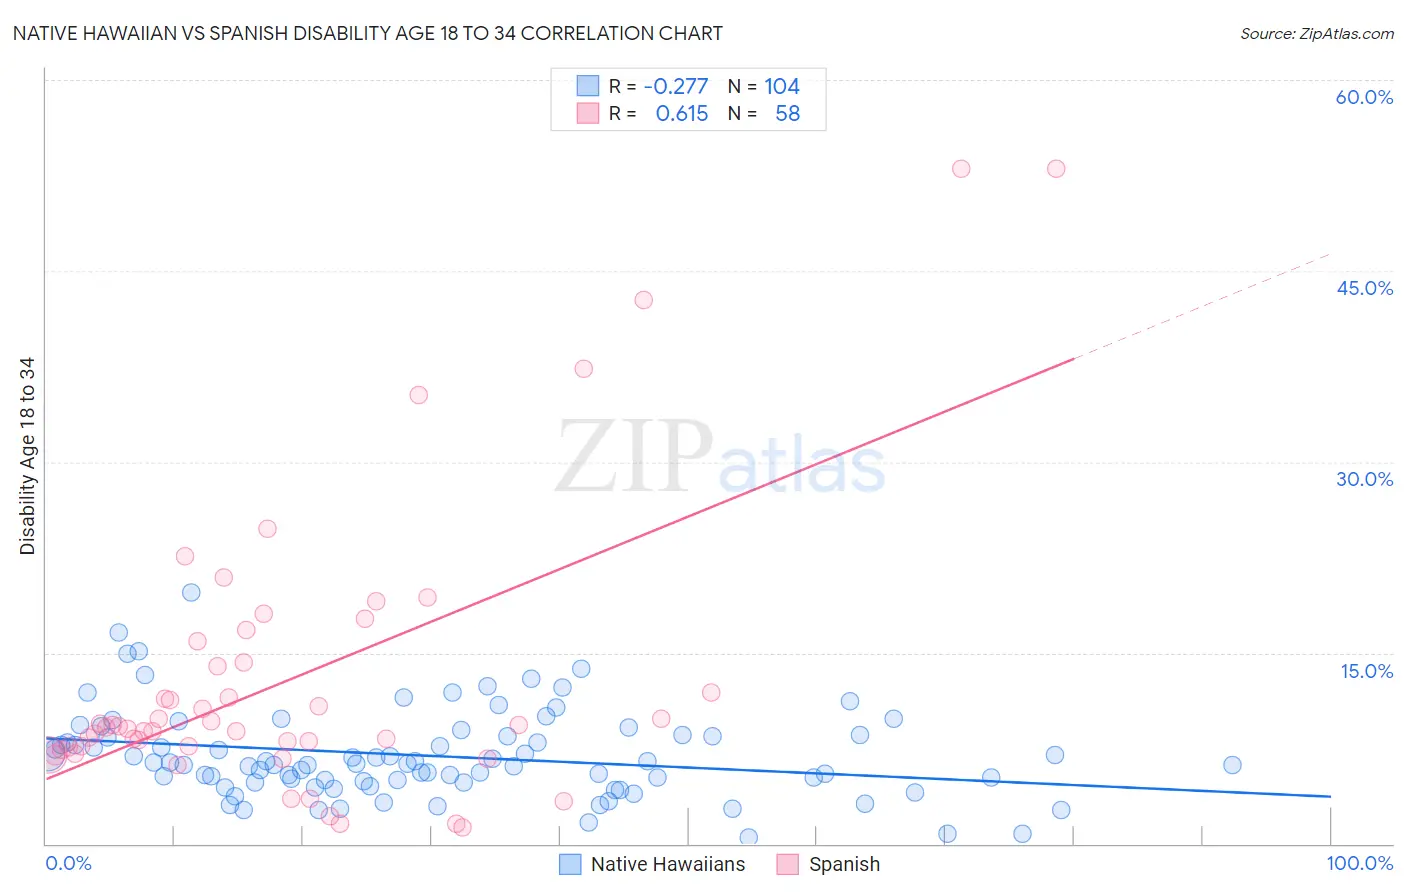
Native Hawaiian vs Spanish Disability Age 18 to 34 Correlation Chart
The statistical analysis conducted on geographies consisting of 331,479,390 people shows a weak negative correlation between the proportion of Native Hawaiians and percentage of population with a disability between the ages 18 and 35 in the United States with a correlation coefficient (R) of -0.277 and weighted average of 6.6%. Similarly, the statistical analysis conducted on geographies consisting of 420,890,896 people shows a significant positive correlation between the proportion of Spanish and percentage of population with a disability between the ages 18 and 35 in the United States with a correlation coefficient (R) of 0.615 and weighted average of 7.5%, a difference of 13.5%.
Disability Age 18 to 34 Correlation Summary
| Measurement | Native Hawaiian | Spanish |
| Minimum | 0.54% | 1.3% |
| Maximum | 19.7% | 53.1% |
| Range | 19.2% | 51.8% |
| Mean | 6.9% | 12.9% |
| Median | 6.3% | 9.2% |
| Interquartile 25% (IQ1) | 4.8% | 7.6% |
| Interquartile 75% (IQ3) | 8.5% | 14.2% |
| Interquartile Range (IQR) | 3.6% | 6.6% |
| Standard Deviation (Sample) | 3.4% | 11.2% |
| Standard Deviation (Population) | 3.4% | 11.1% |
Similar Demographics by Disability Age 18 to 34
Demographics Similar to Native Hawaiians by Disability Age 18 to 34
In terms of disability age 18 to 34, the demographic groups most similar to Native Hawaiians are Immigrants from Cambodia (6.6%, a difference of 0.24%), Immigrants from Mexico (6.6%, a difference of 0.29%), Immigrants from Africa (6.6%, a difference of 0.29%), Ghanaian (6.6%, a difference of 0.33%), and Bahamian (6.6%, a difference of 0.38%).
| Demographics | Rating | Rank | Disability Age 18 to 34 |
| Immigrants | Northern Europe | 64.1 /100 | #167 | Good 6.5% |
| Immigrants | Moldova | 63.1 /100 | #168 | Good 6.5% |
| Russians | 60.2 /100 | #169 | Good 6.5% |
| Immigrants | Bahamas | 57.9 /100 | #170 | Average 6.6% |
| Bahamians | 55.5 /100 | #171 | Average 6.6% |
| Ghanaians | 54.7 /100 | #172 | Average 6.6% |
| Immigrants | Mexico | 54.1 /100 | #173 | Average 6.6% |
| Native Hawaiians | 50.0 /100 | #174 | Average 6.6% |
| Immigrants | Cambodia | 46.5 /100 | #175 | Average 6.6% |
| Immigrants | Africa | 45.9 /100 | #176 | Average 6.6% |
| Syrians | 44.3 /100 | #177 | Average 6.6% |
| Nigerians | 43.7 /100 | #178 | Average 6.6% |
| Immigrants | Ghana | 42.1 /100 | #179 | Average 6.6% |
| Immigrants | Austria | 39.6 /100 | #180 | Fair 6.6% |
| Romanians | 39.5 /100 | #181 | Fair 6.6% |
Demographics Similar to Spanish by Disability Age 18 to 34
In terms of disability age 18 to 34, the demographic groups most similar to Spanish are Danish (7.5%, a difference of 0.10%), Paiute (7.5%, a difference of 0.20%), Hopi (7.5%, a difference of 0.24%), Swedish (7.5%, a difference of 0.66%), and Czechoslovakian (7.4%, a difference of 0.69%).
| Demographics | Rating | Rank | Disability Age 18 to 34 |
| Immigrants | Somalia | 0.1 /100 | #275 | Tragic 7.4% |
| Europeans | 0.1 /100 | #276 | Tragic 7.4% |
| Immigrants | Portugal | 0.1 /100 | #277 | Tragic 7.4% |
| Lumbee | 0.1 /100 | #278 | Tragic 7.4% |
| Czechoslovakians | 0.1 /100 | #279 | Tragic 7.4% |
| Yaqui | 0.1 /100 | #280 | Tragic 7.4% |
| Paiute | 0.0 /100 | #281 | Tragic 7.5% |
| Spanish | 0.0 /100 | #282 | Tragic 7.5% |
| Danes | 0.0 /100 | #283 | Tragic 7.5% |
| Hopi | 0.0 /100 | #284 | Tragic 7.5% |
| Swedes | 0.0 /100 | #285 | Tragic 7.5% |
| Celtics | 0.0 /100 | #286 | Tragic 7.6% |
| Norwegians | 0.0 /100 | #287 | Tragic 7.6% |
| Whites/Caucasians | 0.0 /100 | #288 | Tragic 7.6% |
| Immigrants | Nonimmigrants | 0.0 /100 | #289 | Tragic 7.6% |