Moroccan vs Ugandan Disability Age 65 to 74
COMPARE
Moroccan
Ugandan
Disability Age 65 to 74
Disability Age 65 to 74 Comparison
Moroccans
Ugandans
23.3%
DISABILITY AGE 65 TO 74
54.2/ 100
METRIC RATING
170th/ 347
METRIC RANK
22.7%
DISABILITY AGE 65 TO 74
85.4/ 100
METRIC RATING
140th/ 347
METRIC RANK
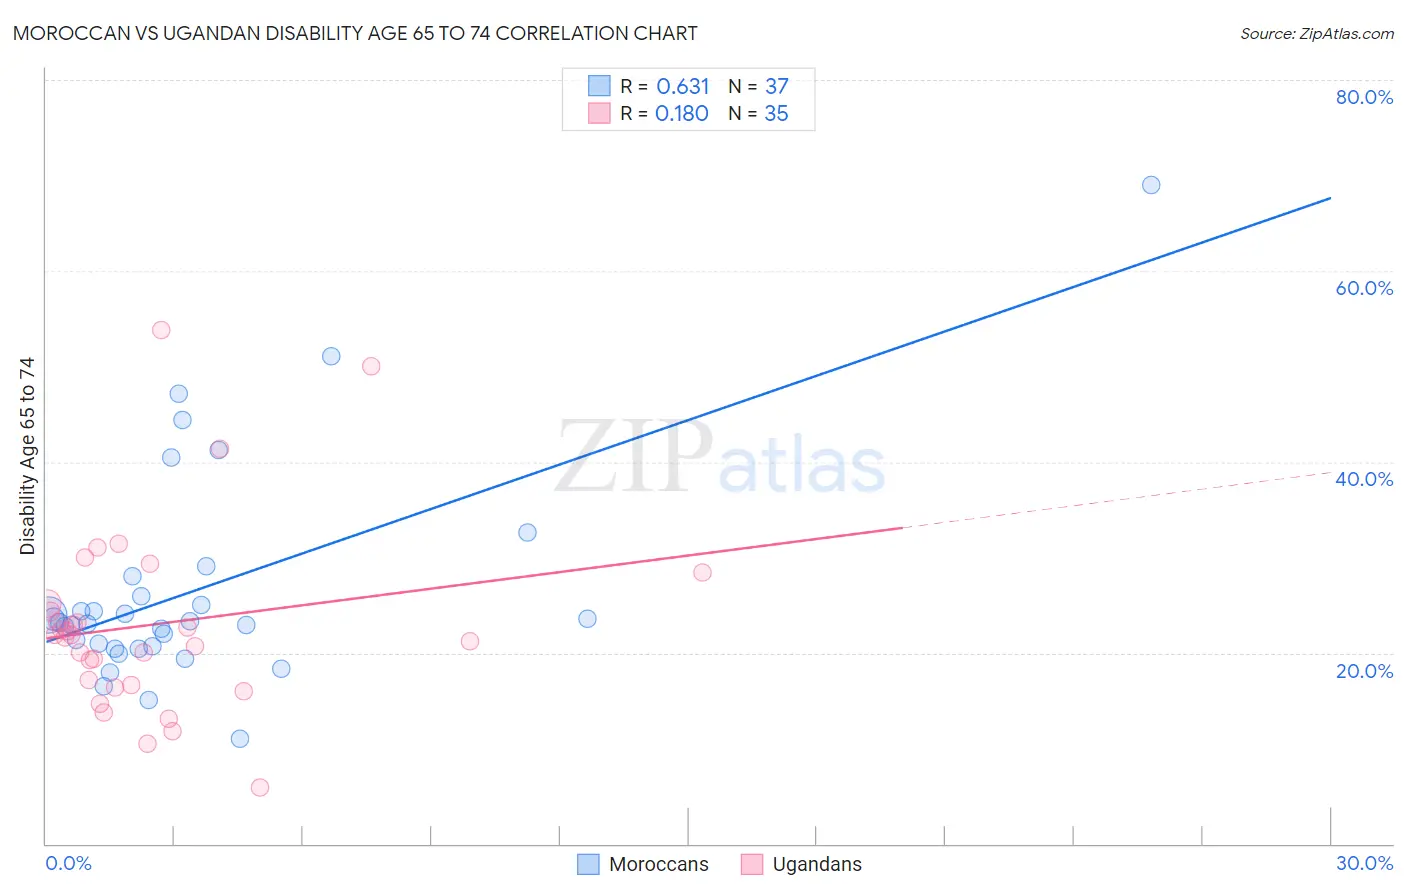
Moroccan vs Ugandan Disability Age 65 to 74 Correlation Chart
The statistical analysis conducted on geographies consisting of 201,651,001 people shows a significant positive correlation between the proportion of Moroccans and percentage of population with a disability between the ages 65 and 75 in the United States with a correlation coefficient (R) of 0.631 and weighted average of 23.3%. Similarly, the statistical analysis conducted on geographies consisting of 93,935,891 people shows a poor positive correlation between the proportion of Ugandans and percentage of population with a disability between the ages 65 and 75 in the United States with a correlation coefficient (R) of 0.180 and weighted average of 22.7%, a difference of 2.4%.
Disability Age 65 to 74 Correlation Summary
| Measurement | Moroccan | Ugandan |
| Minimum | 11.0% | 5.9% |
| Maximum | 69.0% | 53.8% |
| Range | 58.0% | 48.0% |
| Mean | 26.6% | 23.0% |
| Median | 23.2% | 21.9% |
| Interquartile 25% (IQ1) | 20.6% | 16.7% |
| Interquartile 75% (IQ3) | 27.0% | 25.1% |
| Interquartile Range (IQR) | 6.4% | 8.4% |
| Standard Deviation (Sample) | 11.4% | 9.9% |
| Standard Deviation (Population) | 11.2% | 9.8% |
Similar Demographics by Disability Age 65 to 74
Demographics Similar to Moroccans by Disability Age 65 to 74
In terms of disability age 65 to 74, the demographic groups most similar to Moroccans are Icelander (23.3%, a difference of 0.010%), Cuban (23.3%, a difference of 0.13%), Pakistani (23.2%, a difference of 0.16%), Immigrants from Bosnia and Herzegovina (23.2%, a difference of 0.20%), and German (23.3%, a difference of 0.22%).
| Demographics | Rating | Rank | Disability Age 65 to 74 |
| Immigrants | Philippines | 61.1 /100 | #163 | Good 23.2% |
| Sierra Leoneans | 60.9 /100 | #164 | Good 23.2% |
| Vietnamese | 60.8 /100 | #165 | Good 23.2% |
| Immigrants | Afghanistan | 60.5 /100 | #166 | Good 23.2% |
| Immigrants | Bosnia and Herzegovina | 57.6 /100 | #167 | Average 23.2% |
| Pakistanis | 57.0 /100 | #168 | Average 23.2% |
| Icelanders | 54.3 /100 | #169 | Average 23.3% |
| Moroccans | 54.2 /100 | #170 | Average 23.3% |
| Cubans | 51.9 /100 | #171 | Average 23.3% |
| Germans | 50.5 /100 | #172 | Average 23.3% |
| Yugoslavians | 50.2 /100 | #173 | Average 23.3% |
| Immigrants | South Eastern Asia | 50.0 /100 | #174 | Average 23.3% |
| Dutch | 49.4 /100 | #175 | Average 23.3% |
| Immigrants | Eritrea | 47.5 /100 | #176 | Average 23.4% |
| Immigrants | Haiti | 47.5 /100 | #177 | Average 23.4% |
Demographics Similar to Ugandans by Disability Age 65 to 74
In terms of disability age 65 to 74, the demographic groups most similar to Ugandans are Belgian (22.7%, a difference of 0.010%), Immigrants from Ethiopia (22.7%, a difference of 0.020%), Immigrants from Syria (22.7%, a difference of 0.040%), Arab (22.8%, a difference of 0.080%), and Danish (22.8%, a difference of 0.12%).
| Demographics | Rating | Rank | Disability Age 65 to 74 |
| Northern Europeans | 88.9 /100 | #133 | Excellent 22.6% |
| Afghans | 88.6 /100 | #134 | Excellent 22.6% |
| Immigrants | Ukraine | 88.4 /100 | #135 | Excellent 22.6% |
| Ethiopians | 87.9 /100 | #136 | Excellent 22.7% |
| Taiwanese | 87.6 /100 | #137 | Excellent 22.7% |
| Immigrants | Moldova | 87.3 /100 | #138 | Excellent 22.7% |
| Immigrants | Syria | 85.8 /100 | #139 | Excellent 22.7% |
| Ugandans | 85.4 /100 | #140 | Excellent 22.7% |
| Belgians | 85.3 /100 | #141 | Excellent 22.7% |
| Immigrants | Ethiopia | 85.3 /100 | #142 | Excellent 22.7% |
| Arabs | 84.8 /100 | #143 | Excellent 22.8% |
| Danes | 84.4 /100 | #144 | Excellent 22.8% |
| Immigrants | Uganda | 84.0 /100 | #145 | Excellent 22.8% |
| Alsatians | 83.7 /100 | #146 | Excellent 22.8% |
| Immigrants | Uzbekistan | 83.1 /100 | #147 | Excellent 22.8% |