Malaysian vs Arab Disability Age 18 to 34

COMPARE

Malaysian
Race
Ancestry
AfghanAfricanAlaska NativeAlaskan AthabascanAlbanianAleutAlsatianAmericanApacheArapahoArgentineanArmenianAssyrian/Chaldean/SyriacAustralianAustrianBahamianBangladeshiBarbadianBasqueBelgianBelizeanBermudanBhutaneseBlackfeetBolivianBrazilianBritishBritish West IndianBulgarianBurmeseCajunCambodianCanadianCape VerdeanCarpatho RusynCelticCentral AmericanCentral American IndianCherokeeCheyenneChickasawChileanChineseChippewaChoctawColombianColvilleComancheCosta RicanCreeCreekCroatianCrowCubanCypriotCzechCzechoslovakianDanishDelawareDominicanDutchDutch West IndianEastern EuropeanEcuadorianEgyptianEnglishEstonianEthiopianEuropeanFijianFilipinoFinnishFrenchFrench American IndianFrench CanadianGermanGerman RussianGhanaianGreekGuamanian/ChamorroGuatemalanGuyaneseHaitianHmongHonduranHopiHoumaHungarianIcelanderIndian (Asian)IndonesianInupiatIranianIraqiIrishIroquoisIsraeliItalianJamaicanJapaneseJordanianKenyanKiowaKoreanLaotianLatvianLebaneseLiberianLithuanianLumbeeLuxembourgerMacedonianMalaysianMalteseMarshalleseMenomineeMexicanMexican American IndianMongolianMoroccanNative HawaiianNavajoNepaleseNew ZealanderNicaraguanNigerianNorthern EuropeanNorwegianOkinawanOsageOttawaPaiutePakistaniPalestinianPanamanianParaguayanPennsylvania GermanPeruvianPimaPolishPortuguesePotawatomiPuebloPuerto RicanPuget Sound SalishRomanianRussianSalvadoranSamoanScandinavianScotch-IrishScottishSeminoleSenegaleseSerbianShoshoneSierra LeoneanSiouxSlavicSlovakSloveneSomaliSouth AfricanSouth AmericanSouth American IndianSoviet UnionSpaniardSpanishSpanish AmericanSpanish American IndianSri LankanSubsaharan AfricanSudaneseSwedishSwissSyrianTaiwaneseThaiTlingit-HaidaTohono O'OdhamTonganTrinidadian and TobagonianTsimshianTurkishU.S. Virgin IslanderUgandanUkrainianUruguayanUteVenezuelanVietnameseWelshWest IndianYakamaYaquiYugoslavianYumanYup'ikZimbabwean
Immigration
NonimmigrantsImmigrantsAfghanistanAfricaAlbaniaArgentinaArmeniaAsiaAustraliaAustriaBahamasBangladeshBarbadosBelarusBelgiumBelizeBoliviaBosnia and HerzegovinaBrazilBulgariaBurma/MyanmarCabo VerdeCambodiaCameroonCanadaCaribbeanCentral AmericaChileChinaColombiaCongoCosta RicaCroatiaCubaCzechoslovakiaDenmarkDominicaDominican RepublicEastern AfricaEastern AsiaEastern EuropeEcuadorEgyptEl SalvadorEnglandEritreaEthiopiaEuropeFijiFranceGermanyGhanaGreeceGrenadaGuatemalaGuyanaHaitiHondurasHong KongHungaryIndiaIndonesiaIranIraqIrelandIsraelItalyJamaicaJapanJordanKazakhstanKenyaKoreaKuwaitLaosLatin AmericaLatviaLebanonLiberiaLithuaniaMalaysiaMexicoMicronesiaMiddle AfricaMoldovaMoroccoNepalNetherlandsNicaraguaNigeriaNorth AmericaNorth MacedoniaNorthern AfricaNorthern EuropeNorwayOceaniaPakistanPanamaPeruPhilippinesPolandPortugalRomaniaRussiaSaudi ArabiaScotlandSenegalSerbiaSierra LeoneSingaporeSomaliaSouth AfricaSouth AmericaSouth Central AsiaSouth Eastern AsiaSouthern EuropeSpainSri LankaSt. Vincent and the GrenadinesSudanSwedenSwitzerlandSyriaTaiwanThailandTrinidad and TobagoTurkeyUgandaUkraineUruguayUzbekistanVenezuelaVietnamWest IndiesWestern AfricaWestern AsiaWestern EuropeYemenZaireZimbabweAzores
Arab
Race
Ancestry
AfghanAfricanAlaska NativeAlaskan AthabascanAlbanianAleutAlsatianAmericanApacheArabArapahoArgentineanArmenianAssyrian/Chaldean/SyriacAustralianAustrianBahamianBangladeshiBarbadianBasqueBelgianBelizeanBermudanBhutaneseBlackfeetBolivianBrazilianBritishBritish West IndianBulgarianBurmeseCajunCambodianCanadianCape VerdeanCarpatho RusynCelticCentral AmericanCentral American IndianCherokeeCheyenneChickasawChileanChineseChippewaChoctawColombianColvilleComancheCosta RicanCreeCreekCroatianCrowCubanCypriotCzechCzechoslovakianDanishDelawareDominicanDutchDutch West IndianEastern EuropeanEcuadorianEgyptianEnglishEstonianEthiopianEuropeanFijianFilipinoFinnishFrenchFrench American IndianFrench CanadianGermanGerman RussianGhanaianGreekGuamanian/ChamorroGuatemalanGuyaneseHaitianHmongHonduranHopiHoumaHungarianIcelanderIndian (Asian)IndonesianInupiatIranianIraqiIrishIroquoisIsraeliItalianJamaicanJapaneseJordanianKenyanKiowaKoreanLaotianLatvianLebaneseLiberianLithuanianLumbeeLuxembourgerMacedonianMalteseMarshalleseMenomineeMexicanMexican American IndianMongolianMoroccanNative HawaiianNavajoNepaleseNew ZealanderNicaraguanNigerianNorthern EuropeanNorwegianOkinawanOsageOttawaPaiutePakistaniPalestinianPanamanianParaguayanPennsylvania GermanPeruvianPimaPolishPortuguesePotawatomiPuebloPuerto RicanPuget Sound SalishRomanianRussianSalvadoranSamoanScandinavianScotch-IrishScottishSeminoleSenegaleseSerbianShoshoneSierra LeoneanSiouxSlavicSlovakSloveneSomaliSouth AfricanSouth AmericanSouth American IndianSoviet UnionSpaniardSpanishSpanish AmericanSpanish American IndianSri LankanSubsaharan AfricanSudaneseSwedishSwissSyrianTaiwaneseThaiTlingit-HaidaTohono O'OdhamTonganTrinidadian and TobagonianTsimshianTurkishU.S. Virgin IslanderUgandanUkrainianUruguayanUteVenezuelanVietnameseWelshWest IndianYakamaYaquiYugoslavianYumanYup'ikZimbabwean
Immigration
NonimmigrantsImmigrantsAfghanistanAfricaAlbaniaArgentinaArmeniaAsiaAustraliaAustriaBahamasBangladeshBarbadosBelarusBelgiumBelizeBoliviaBosnia and HerzegovinaBrazilBulgariaBurma/MyanmarCabo VerdeCambodiaCameroonCanadaCaribbeanCentral AmericaChileChinaColombiaCongoCosta RicaCroatiaCubaCzechoslovakiaDenmarkDominicaDominican RepublicEastern AfricaEastern AsiaEastern EuropeEcuadorEgyptEl SalvadorEnglandEritreaEthiopiaEuropeFijiFranceGermanyGhanaGreeceGrenadaGuatemalaGuyanaHaitiHondurasHong KongHungaryIndiaIndonesiaIranIraqIrelandIsraelItalyJamaicaJapanJordanKazakhstanKenyaKoreaKuwaitLaosLatin AmericaLatviaLebanonLiberiaLithuaniaMalaysiaMexicoMicronesiaMiddle AfricaMoldovaMoroccoNepalNetherlandsNicaraguaNigeriaNorth AmericaNorth MacedoniaNorthern AfricaNorthern EuropeNorwayOceaniaPakistanPanamaPeruPhilippinesPolandPortugalRomaniaRussiaSaudi ArabiaScotlandSenegalSerbiaSierra LeoneSingaporeSomaliaSouth AfricaSouth AmericaSouth Central AsiaSouth Eastern AsiaSouthern EuropeSpainSri LankaSt. Vincent and the GrenadinesSudanSwedenSwitzerlandSyriaTaiwanThailandTrinidad and TobagoTurkeyUgandaUkraineUruguayUzbekistanVenezuelaVietnamWest IndiesWestern AfricaWestern AsiaWestern EuropeYemenZaireZimbabweAzores
Disability Age 18 to 34
Income
Poverty
Unemployment
Labor Participation
Family Structure
Vehicle Availability
Education Level
Disability

Disability Age 18 to 34 Comparison

Malaysians

Arabs

Tragic
Good
7.2%
DISABILITY AGE 18 TO 34
0.7/ 100
METRIC RATING
249th/ 347
METRIC RANK
6.5%
DISABILITY AGE 18 TO 34
72.3/ 100
METRIC RATING
161st/ 347
METRIC RANK

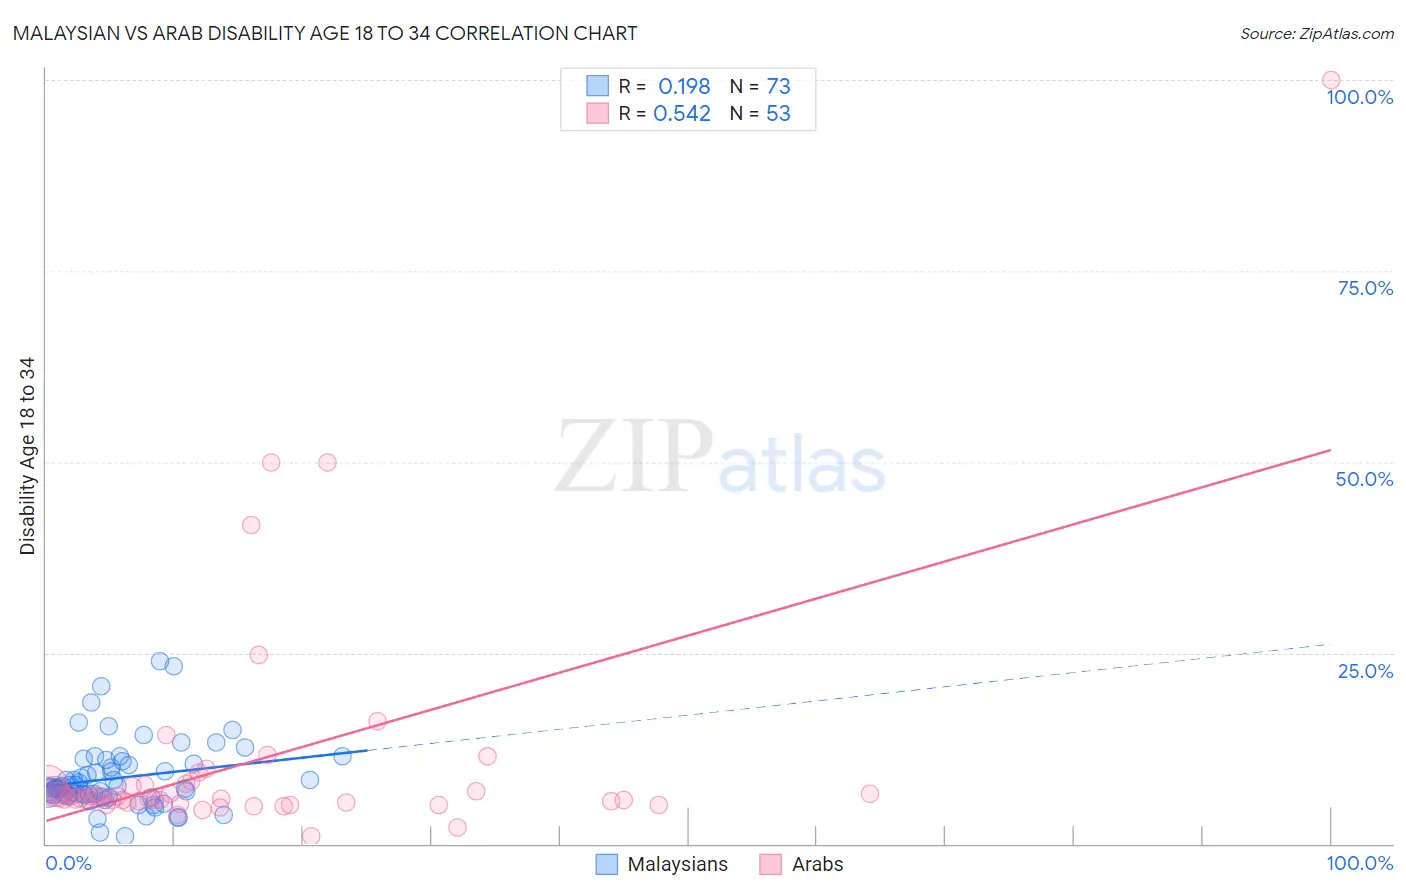
Malaysian vs Arab Disability Age 18 to 34 Correlation Chart

The statistical analysis conducted on geographies consisting of 225,903,821 people shows a poor positive correlation between the proportion of Malaysians and percentage of population with a disability between the ages 18 and 35 in the United States with a correlation coefficient (R) of 0.198 and weighted average of 7.2%. Similarly, the statistical analysis conducted on geographies consisting of 485,206,090 people shows a substantial positive correlation between the proportion of Arabs and percentage of population with a disability between the ages 18 and 35 in the United States with a correlation coefficient (R) of 0.542 and weighted average of 6.5%, a difference of 10.4%.
Malaysian vs Arab Disability Age 18 to 34

Disability Age 18 to 34 Correlation Summary

MeasurementMalaysianArab
Minimum0.97%0.92%
Maximum23.9%100.0%
Range23.0%99.1%
Mean8.6%10.9%
Median7.3%6.1%
Interquartile 25% (IQ1)6.4%5.4%
Interquartile 75% (IQ3)10.4%7.8%
Interquartile Range (IQR)4.0%2.4%
Standard Deviation (Sample)4.4%16.0%
Standard Deviation (Population)4.4%15.9%

Similar Demographics by Disability Age 18 to 34

Demographics Similar to Malaysians by Disability Age 18 to 34

In terms of disability age 18 to 34, the demographic groups most similar to Malaysians are Guamanian/Chamorro (7.2%, a difference of 0.10%), Yugoslavian (7.2%, a difference of 0.13%), Immigrants from Liberia (7.1%, a difference of 0.28%), Fijian (7.2%, a difference of 0.29%), and Hungarian (7.1%, a difference of 0.30%).
DemographicsRating | RankDisability Age 18 to 34
Immigrants | Congo
1.1
/100
|
#242
Tragic
7.1%
Icelanders
1.0
/100
|
#243
Tragic
7.1%
Immigrants | Zaire
0.9
/100
|
#244
Tragic
7.1%
Hungarians
0.9
/100
|
#245
Tragic
7.1%
Immigrants | Liberia
0.8
/100
|
#246
Tragic
7.1%
Yugoslavians
0.8
/100
|
#247
Tragic
7.2%
Guamanians/Chamorros
0.8
/100
|
#248
Tragic
7.2%
Malaysians
0.7
/100
|
#249
Tragic
7.2%
Fijians
0.6
/100
|
#250
Tragic
7.2%
Spaniards
0.6
/100
|
#251
Tragic
7.2%
Poles
0.6
/100
|
#252
Tragic
7.2%
Croatians
0.5
/100
|
#253
Tragic
7.2%
Indonesians
0.4
/100
|
#254
Tragic
7.2%
Immigrants | Germany
0.4
/100
|
#255
Tragic
7.2%
Immigrants | Laos
0.4
/100
|
#256
Tragic
7.2%

Demographics Similar to Arabs by Disability Age 18 to 34

In terms of disability age 18 to 34, the demographic groups most similar to Arabs are Immigrants from Southern Europe (6.5%, a difference of 0.020%), South African (6.5%, a difference of 0.060%), Immigrants from Denmark (6.5%, a difference of 0.060%), Dominican (6.5%, a difference of 0.11%), and Immigrants from Nigeria (6.5%, a difference of 0.17%).
DemographicsRating | RankDisability Age 18 to 34
Immigrants | Central America
76.8
/100
|
#154
Good
6.5%
Inupiat
76.7
/100
|
#155
Good
6.5%
Immigrants | Panama
75.3
/100
|
#156
Good
6.5%
Immigrants | Sierra Leone
75.0
/100
|
#157
Good
6.5%
Zimbabweans
74.7
/100
|
#158
Good
6.5%
Dominicans
73.6
/100
|
#159
Good
6.5%
Immigrants | Southern Europe
72.5
/100
|
#160
Good
6.5%
Arabs
72.3
/100
|
#161
Good
6.5%
South Africans
71.7
/100
|
#162
Good
6.5%
Immigrants | Denmark
71.7
/100
|
#163
Good
6.5%
Immigrants | Nigeria
70.4
/100
|
#164
Good
6.5%
Immigrants | Hungary
69.6
/100
|
#165
Good
6.5%
Eastern Europeans
65.1
/100
|
#166
Good
6.5%
Immigrants | Northern Europe
64.1
/100
|
#167
Good
6.5%
Immigrants | Moldova
63.1
/100
|
#168
Good
6.5%