Macedonian vs Immigrants from Jordan Vision Disability
COMPARE
Macedonian
Immigrants from Jordan
Vision Disability
Vision Disability Comparison
Macedonians
Immigrants from Jordan
2.0%
VISION DISABILITY
99.3/ 100
METRIC RATING
54th/ 347
METRIC RANK
2.0%
VISION DISABILITY
98.3/ 100
METRIC RATING
77th/ 347
METRIC RANK
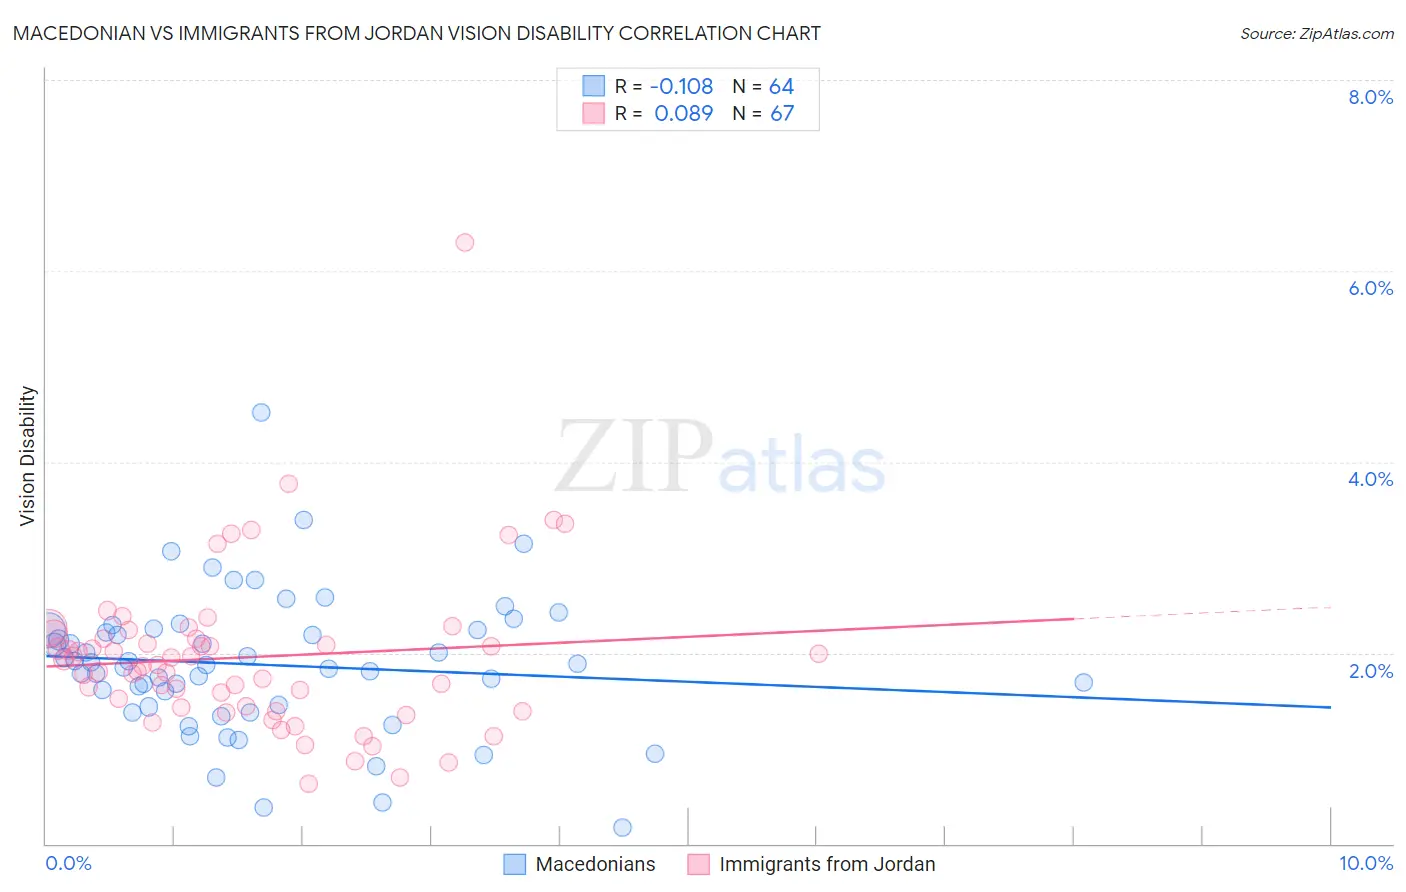
Macedonian vs Immigrants from Jordan Vision Disability Correlation Chart
The statistical analysis conducted on geographies consisting of 132,627,302 people shows a poor negative correlation between the proportion of Macedonians and percentage of population with vision disability in the United States with a correlation coefficient (R) of -0.108 and weighted average of 2.0%. Similarly, the statistical analysis conducted on geographies consisting of 181,247,850 people shows a slight positive correlation between the proportion of Immigrants from Jordan and percentage of population with vision disability in the United States with a correlation coefficient (R) of 0.089 and weighted average of 2.0%, a difference of 1.6%.
Vision Disability Correlation Summary
| Measurement | Macedonian | Immigrants from Jordan |
| Minimum | 0.17% | 0.63% |
| Maximum | 4.5% | 6.3% |
| Range | 4.4% | 5.7% |
| Mean | 1.9% | 2.0% |
| Median | 1.9% | 1.9% |
| Interquartile 25% (IQ1) | 1.4% | 1.4% |
| Interquartile 75% (IQ3) | 2.2% | 2.2% |
| Interquartile Range (IQR) | 0.79% | 0.73% |
| Standard Deviation (Sample) | 0.73% | 0.85% |
| Standard Deviation (Population) | 0.73% | 0.84% |
Similar Demographics by Vision Disability
Demographics Similar to Macedonians by Vision Disability
In terms of vision disability, the demographic groups most similar to Macedonians are Immigrants from Belarus (2.0%, a difference of 0.040%), Laotian (2.0%, a difference of 0.060%), Immigrants from Serbia (2.0%, a difference of 0.15%), Jordanian (2.0%, a difference of 0.22%), and Somali (2.0%, a difference of 0.24%).
| Demographics | Rating | Rank | Vision Disability |
| Immigrants | Bulgaria | 99.7 /100 | #47 | Exceptional 2.0% |
| Israelis | 99.6 /100 | #48 | Exceptional 2.0% |
| Latvians | 99.5 /100 | #49 | Exceptional 2.0% |
| Afghans | 99.5 /100 | #50 | Exceptional 2.0% |
| Tongans | 99.5 /100 | #51 | Exceptional 2.0% |
| Immigrants | Serbia | 99.4 /100 | #52 | Exceptional 2.0% |
| Immigrants | Belarus | 99.3 /100 | #53 | Exceptional 2.0% |
| Macedonians | 99.3 /100 | #54 | Exceptional 2.0% |
| Laotians | 99.3 /100 | #55 | Exceptional 2.0% |
| Jordanians | 99.2 /100 | #56 | Exceptional 2.0% |
| Somalis | 99.2 /100 | #57 | Exceptional 2.0% |
| Immigrants | Saudi Arabia | 99.2 /100 | #58 | Exceptional 2.0% |
| Argentineans | 99.1 /100 | #59 | Exceptional 2.0% |
| Immigrants | Romania | 99.1 /100 | #60 | Exceptional 2.0% |
| Immigrants | Belgium | 99.1 /100 | #61 | Exceptional 2.0% |
Demographics Similar to Immigrants from Jordan by Vision Disability
In terms of vision disability, the demographic groups most similar to Immigrants from Jordan are Paraguayan (2.0%, a difference of 0.0%), Palestinian (2.0%, a difference of 0.020%), Immigrants from North Macedonia (2.0%, a difference of 0.020%), Immigrants from Eastern Europe (2.0%, a difference of 0.030%), and Immigrants from Eritrea (2.0%, a difference of 0.080%).
| Demographics | Rating | Rank | Vision Disability |
| Immigrants | Kazakhstan | 98.6 /100 | #70 | Exceptional 2.0% |
| Immigrants | Northern Europe | 98.6 /100 | #71 | Exceptional 2.0% |
| Immigrants | France | 98.5 /100 | #72 | Exceptional 2.0% |
| Immigrants | Eritrea | 98.4 /100 | #73 | Exceptional 2.0% |
| Palestinians | 98.3 /100 | #74 | Exceptional 2.0% |
| Immigrants | North Macedonia | 98.3 /100 | #75 | Exceptional 2.0% |
| Paraguayans | 98.3 /100 | #76 | Exceptional 2.0% |
| Immigrants | Jordan | 98.3 /100 | #77 | Exceptional 2.0% |
| Immigrants | Eastern Europe | 98.3 /100 | #78 | Exceptional 2.0% |
| Assyrians/Chaldeans/Syriacs | 98.1 /100 | #79 | Exceptional 2.0% |
| Lithuanians | 97.7 /100 | #80 | Exceptional 2.0% |
| Soviet Union | 97.6 /100 | #81 | Exceptional 2.0% |
| Immigrants | Poland | 97.6 /100 | #82 | Exceptional 2.0% |
| Immigrants | Western Asia | 97.5 /100 | #83 | Exceptional 2.0% |
| Immigrants | Latvia | 97.3 /100 | #84 | Exceptional 2.0% |