Liberian vs Yup'ik Disability Age 65 to 74
COMPARE
Liberian
Yup'ik
Disability Age 65 to 74
Disability Age 65 to 74 Comparison
Liberians
Yup'ik
25.6%
DISABILITY AGE 65 TO 74
0.1/ 100
METRIC RATING
268th/ 347
METRIC RANK
37.8%
DISABILITY AGE 65 TO 74
0.0/ 100
METRIC RATING
346th/ 347
METRIC RANK
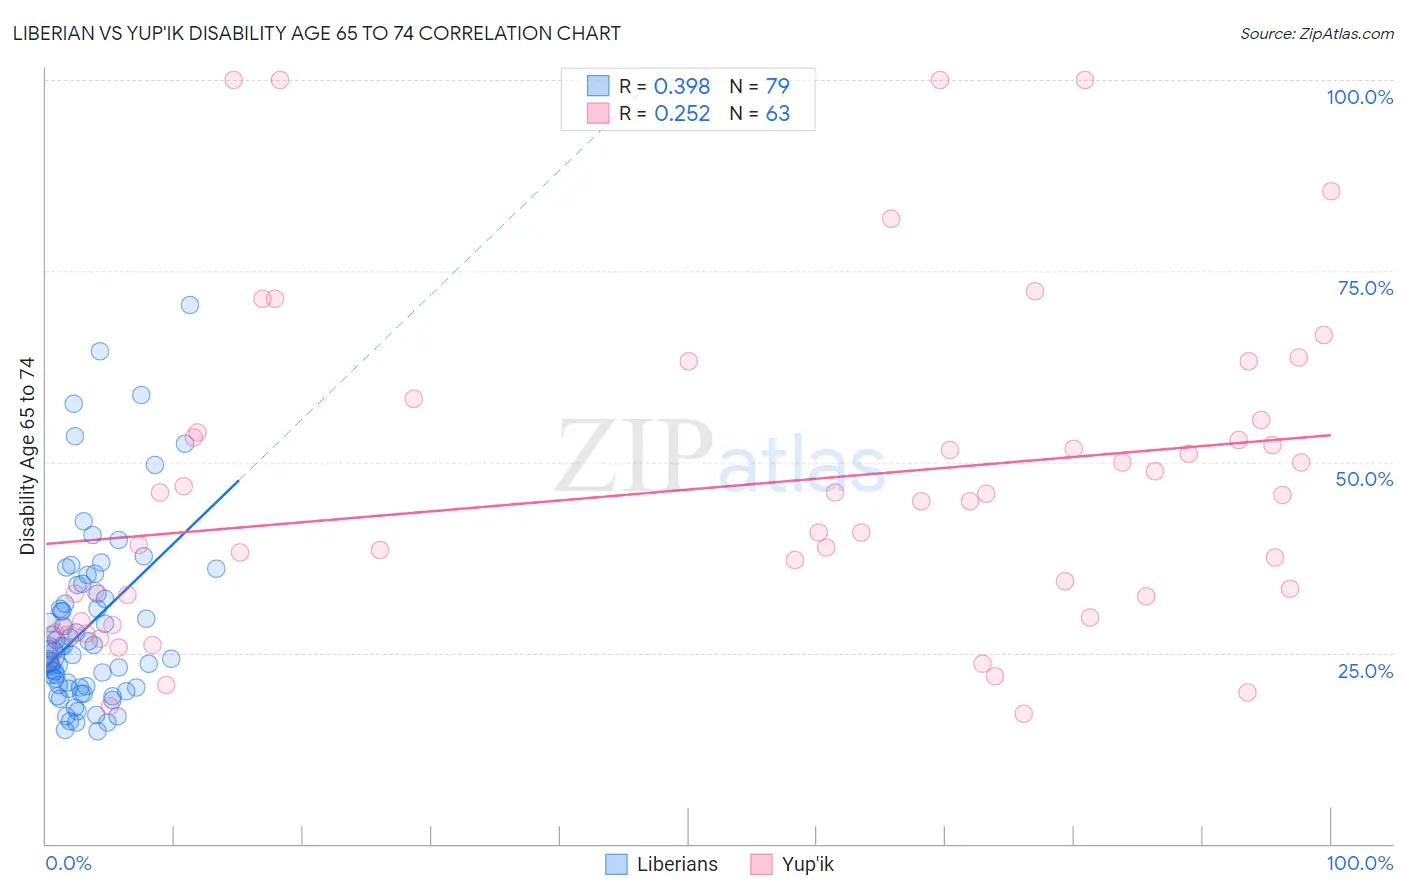
Liberian vs Yup'ik Disability Age 65 to 74 Correlation Chart
The statistical analysis conducted on geographies consisting of 117,958,133 people shows a mild positive correlation between the proportion of Liberians and percentage of population with a disability between the ages 65 and 75 in the United States with a correlation coefficient (R) of 0.398 and weighted average of 25.6%. Similarly, the statistical analysis conducted on geographies consisting of 39,932,947 people shows a weak positive correlation between the proportion of Yup'ik and percentage of population with a disability between the ages 65 and 75 in the United States with a correlation coefficient (R) of 0.252 and weighted average of 37.8%, a difference of 47.6%.
Disability Age 65 to 74 Correlation Summary
| Measurement | Liberian | Yup'ik |
| Minimum | 14.7% | 16.9% |
| Maximum | 70.5% | 100.0% |
| Range | 55.7% | 83.1% |
| Mean | 28.4% | 46.4% |
| Median | 25.2% | 44.8% |
| Interquartile 25% (IQ1) | 20.5% | 29.1% |
| Interquartile 75% (IQ3) | 32.7% | 53.8% |
| Interquartile Range (IQR) | 12.2% | 24.8% |
| Standard Deviation (Sample) | 11.5% | 21.1% |
| Standard Deviation (Population) | 11.5% | 21.0% |
Similar Demographics by Disability Age 65 to 74
Demographics Similar to Liberians by Disability Age 65 to 74
In terms of disability age 65 to 74, the demographic groups most similar to Liberians are Ottawa (25.6%, a difference of 0.10%), Hmong (25.7%, a difference of 0.12%), Immigrants from Guatemala (25.7%, a difference of 0.20%), Immigrants from Liberia (25.7%, a difference of 0.23%), and Immigrants from Dominica (25.7%, a difference of 0.23%).
| Demographics | Rating | Rank | Disability Age 65 to 74 |
| Cape Verdeans | 0.2 /100 | #261 | Tragic 25.4% |
| Samoans | 0.2 /100 | #262 | Tragic 25.4% |
| Iroquois | 0.2 /100 | #263 | Tragic 25.4% |
| Hawaiians | 0.2 /100 | #264 | Tragic 25.5% |
| Guatemalans | 0.2 /100 | #265 | Tragic 25.5% |
| Immigrants | Latin America | 0.1 /100 | #266 | Tragic 25.6% |
| Ottawa | 0.1 /100 | #267 | Tragic 25.6% |
| Liberians | 0.1 /100 | #268 | Tragic 25.6% |
| Hmong | 0.1 /100 | #269 | Tragic 25.7% |
| Immigrants | Guatemala | 0.1 /100 | #270 | Tragic 25.7% |
| Immigrants | Liberia | 0.1 /100 | #271 | Tragic 25.7% |
| Immigrants | Dominica | 0.1 /100 | #272 | Tragic 25.7% |
| Japanese | 0.1 /100 | #273 | Tragic 25.7% |
| Americans | 0.1 /100 | #274 | Tragic 25.8% |
| Hondurans | 0.1 /100 | #275 | Tragic 25.8% |
Demographics Similar to Yup'ik by Disability Age 65 to 74
In terms of disability age 65 to 74, the demographic groups most similar to Yup'ik are Pima (38.6%, a difference of 2.0%), Tohono O'odham (36.0%, a difference of 5.0%), Inupiat (34.5%, a difference of 9.6%), Navajo (33.3%, a difference of 13.5%), and Pueblo (33.1%, a difference of 14.3%).
| Demographics | Rating | Rank | Disability Age 65 to 74 |
| Colville | 0.0 /100 | #333 | Tragic 30.5% |
| Alaska Natives | 0.0 /100 | #334 | Tragic 30.6% |
| Cheyenne | 0.0 /100 | #335 | Tragic 31.1% |
| Yuman | 0.0 /100 | #336 | Tragic 31.5% |
| Houma | 0.0 /100 | #337 | Tragic 32.3% |
| Alaskan Athabascans | 0.0 /100 | #338 | Tragic 32.4% |
| Kiowa | 0.0 /100 | #339 | Tragic 32.6% |
| Lumbee | 0.0 /100 | #340 | Tragic 32.7% |
| Tsimshian | 0.0 /100 | #341 | Tragic 32.9% |
| Pueblo | 0.0 /100 | #342 | Tragic 33.1% |
| Navajo | 0.0 /100 | #343 | Tragic 33.3% |
| Inupiat | 0.0 /100 | #344 | Tragic 34.5% |
| Tohono O'odham | 0.0 /100 | #345 | Tragic 36.0% |
| Yup'ik | 0.0 /100 | #346 | Tragic 37.8% |
| Pima | 0.0 /100 | #347 | Tragic 38.6% |