Latvian vs Colombian Disability Age 18 to 34

COMPARE

Latvian
Race
Ancestry
AfghanAfricanAlaska NativeAlaskan AthabascanAlbanianAleutAlsatianAmericanApacheArabArapahoArgentineanArmenianAssyrian/Chaldean/SyriacAustralianAustrianBahamianBangladeshiBarbadianBasqueBelgianBelizeanBermudanBhutaneseBlackfeetBolivianBrazilianBritishBritish West IndianBulgarianBurmeseCajunCambodianCanadianCape VerdeanCarpatho RusynCelticCentral AmericanCentral American IndianCherokeeCheyenneChickasawChileanChineseChippewaChoctawColvilleComancheCosta RicanCreeCreekCroatianCrowCubanCypriotCzechCzechoslovakianDanishDelawareDominicanDutchDutch West IndianEastern EuropeanEcuadorianEgyptianEnglishEstonianEthiopianEuropeanFijianFilipinoFinnishFrenchFrench American IndianFrench CanadianGermanGerman RussianGhanaianGreekGuamanian/ChamorroGuatemalanGuyaneseHaitianHmongHonduranHopiHoumaHungarianIcelanderIndian (Asian)IndonesianInupiatIranianIraqiIrishIroquoisIsraeliItalianJamaicanJapaneseJordanianKenyanKiowaKoreanLaotianLatvianLebaneseLiberianLithuanianLumbeeLuxembourgerMacedonianMalaysianMalteseMarshalleseMenomineeMexicanMexican American IndianMongolianMoroccanNative HawaiianNavajoNepaleseNew ZealanderNicaraguanNigerianNorthern EuropeanNorwegianOkinawanOsageOttawaPaiutePakistaniPalestinianPanamanianParaguayanPennsylvania GermanPeruvianPimaPolishPortuguesePotawatomiPuebloPuerto RicanPuget Sound SalishRomanianRussianSalvadoranSamoanScandinavianScotch-IrishScottishSeminoleSenegaleseSerbianShoshoneSierra LeoneanSiouxSlavicSlovakSloveneSomaliSouth AfricanSouth AmericanSouth American IndianSoviet UnionSpaniardSpanishSpanish AmericanSpanish American IndianSri LankanSubsaharan AfricanSudaneseSwedishSwissSyrianTaiwaneseThaiTlingit-HaidaTohono O'OdhamTonganTrinidadian and TobagonianTsimshianTurkishU.S. Virgin IslanderUgandanUkrainianUruguayanUteVenezuelanVietnameseWelshWest IndianYakamaYaquiYugoslavianYumanYup'ikZimbabwean
Immigration
NonimmigrantsImmigrantsAfghanistanAfricaAlbaniaArgentinaArmeniaAsiaAustraliaAustriaBahamasBangladeshBarbadosBelarusBelgiumBelizeBoliviaBosnia and HerzegovinaBrazilBulgariaBurma/MyanmarCabo VerdeCambodiaCameroonCanadaCaribbeanCentral AmericaChileChinaColombiaCongoCosta RicaCroatiaCubaCzechoslovakiaDenmarkDominicaDominican RepublicEastern AfricaEastern AsiaEastern EuropeEcuadorEgyptEl SalvadorEnglandEritreaEthiopiaEuropeFijiFranceGermanyGhanaGreeceGrenadaGuatemalaGuyanaHaitiHondurasHong KongHungaryIndiaIndonesiaIranIraqIrelandIsraelItalyJamaicaJapanJordanKazakhstanKenyaKoreaKuwaitLaosLatin AmericaLatviaLebanonLiberiaLithuaniaMalaysiaMexicoMicronesiaMiddle AfricaMoldovaMoroccoNepalNetherlandsNicaraguaNigeriaNorth AmericaNorth MacedoniaNorthern AfricaNorthern EuropeNorwayOceaniaPakistanPanamaPeruPhilippinesPolandPortugalRomaniaRussiaSaudi ArabiaScotlandSenegalSerbiaSierra LeoneSingaporeSomaliaSouth AfricaSouth AmericaSouth Central AsiaSouth Eastern AsiaSouthern EuropeSpainSri LankaSt. Vincent and the GrenadinesSudanSwedenSwitzerlandSyriaTaiwanThailandTrinidad and TobagoTurkeyUgandaUkraineUruguayUzbekistanVenezuelaVietnamWest IndiesWestern AfricaWestern AsiaWestern EuropeYemenZaireZimbabweAzores
Colombian
Race
Ancestry
AfghanAfricanAlaska NativeAlaskan AthabascanAlbanianAleutAlsatianAmericanApacheArabArapahoArgentineanArmenianAssyrian/Chaldean/SyriacAustralianAustrianBahamianBangladeshiBarbadianBasqueBelgianBelizeanBermudanBhutaneseBlackfeetBolivianBrazilianBritishBritish West IndianBulgarianBurmeseCajunCambodianCanadianCape VerdeanCarpatho RusynCelticCentral AmericanCentral American IndianCherokeeCheyenneChickasawChileanChineseChippewaChoctawColombianColvilleComancheCosta RicanCreeCreekCroatianCrowCubanCypriotCzechCzechoslovakianDanishDelawareDominicanDutchDutch West IndianEastern EuropeanEcuadorianEgyptianEnglishEstonianEthiopianEuropeanFijianFilipinoFinnishFrenchFrench American IndianFrench CanadianGermanGerman RussianGhanaianGreekGuamanian/ChamorroGuatemalanGuyaneseHaitianHmongHonduranHopiHoumaHungarianIcelanderIndian (Asian)IndonesianInupiatIranianIraqiIrishIroquoisIsraeliItalianJamaicanJapaneseJordanianKenyanKiowaKoreanLaotianLebaneseLiberianLithuanianLumbeeLuxembourgerMacedonianMalaysianMalteseMarshalleseMenomineeMexicanMexican American IndianMongolianMoroccanNative HawaiianNavajoNepaleseNew ZealanderNicaraguanNigerianNorthern EuropeanNorwegianOkinawanOsageOttawaPaiutePakistaniPalestinianPanamanianParaguayanPennsylvania GermanPeruvianPimaPolishPortuguesePotawatomiPuebloPuerto RicanPuget Sound SalishRomanianRussianSalvadoranSamoanScandinavianScotch-IrishScottishSeminoleSenegaleseSerbianShoshoneSierra LeoneanSiouxSlavicSlovakSloveneSomaliSouth AfricanSouth AmericanSouth American IndianSoviet UnionSpaniardSpanishSpanish AmericanSpanish American IndianSri LankanSubsaharan AfricanSudaneseSwedishSwissSyrianTaiwaneseThaiTlingit-HaidaTohono O'OdhamTonganTrinidadian and TobagonianTsimshianTurkishU.S. Virgin IslanderUgandanUkrainianUruguayanUteVenezuelanVietnameseWelshWest IndianYakamaYaquiYugoslavianYumanYup'ikZimbabwean
Immigration
NonimmigrantsImmigrantsAfghanistanAfricaAlbaniaArgentinaArmeniaAsiaAustraliaAustriaBahamasBangladeshBarbadosBelarusBelgiumBelizeBoliviaBosnia and HerzegovinaBrazilBulgariaBurma/MyanmarCabo VerdeCambodiaCameroonCanadaCaribbeanCentral AmericaChileChinaColombiaCongoCosta RicaCroatiaCubaCzechoslovakiaDenmarkDominicaDominican RepublicEastern AfricaEastern AsiaEastern EuropeEcuadorEgyptEl SalvadorEnglandEritreaEthiopiaEuropeFijiFranceGermanyGhanaGreeceGrenadaGuatemalaGuyanaHaitiHondurasHong KongHungaryIndiaIndonesiaIranIraqIrelandIsraelItalyJamaicaJapanJordanKazakhstanKenyaKoreaKuwaitLaosLatin AmericaLatviaLebanonLiberiaLithuaniaMalaysiaMexicoMicronesiaMiddle AfricaMoldovaMoroccoNepalNetherlandsNicaraguaNigeriaNorth AmericaNorth MacedoniaNorthern AfricaNorthern EuropeNorwayOceaniaPakistanPanamaPeruPhilippinesPolandPortugalRomaniaRussiaSaudi ArabiaScotlandSenegalSerbiaSierra LeoneSingaporeSomaliaSouth AfricaSouth AmericaSouth Central AsiaSouth Eastern AsiaSouthern EuropeSpainSri LankaSt. Vincent and the GrenadinesSudanSwedenSwitzerlandSyriaTaiwanThailandTrinidad and TobagoTurkeyUgandaUkraineUruguayUzbekistanVenezuelaVietnamWest IndiesWestern AfricaWestern AsiaWestern EuropeYemenZaireZimbabweAzores
Disability Age 18 to 34
Income
Poverty
Unemployment
Labor Participation
Family Structure
Vehicle Availability
Education Level
Disability

Disability Age 18 to 34 Comparison

Latvians

Colombians

Poor
Exceptional
6.8%
DISABILITY AGE 18 TO 34
11.1/ 100
METRIC RATING
210th/ 347
METRIC RANK
5.9%
DISABILITY AGE 18 TO 34
99.8/ 100
METRIC RATING
42nd/ 347
METRIC RANK

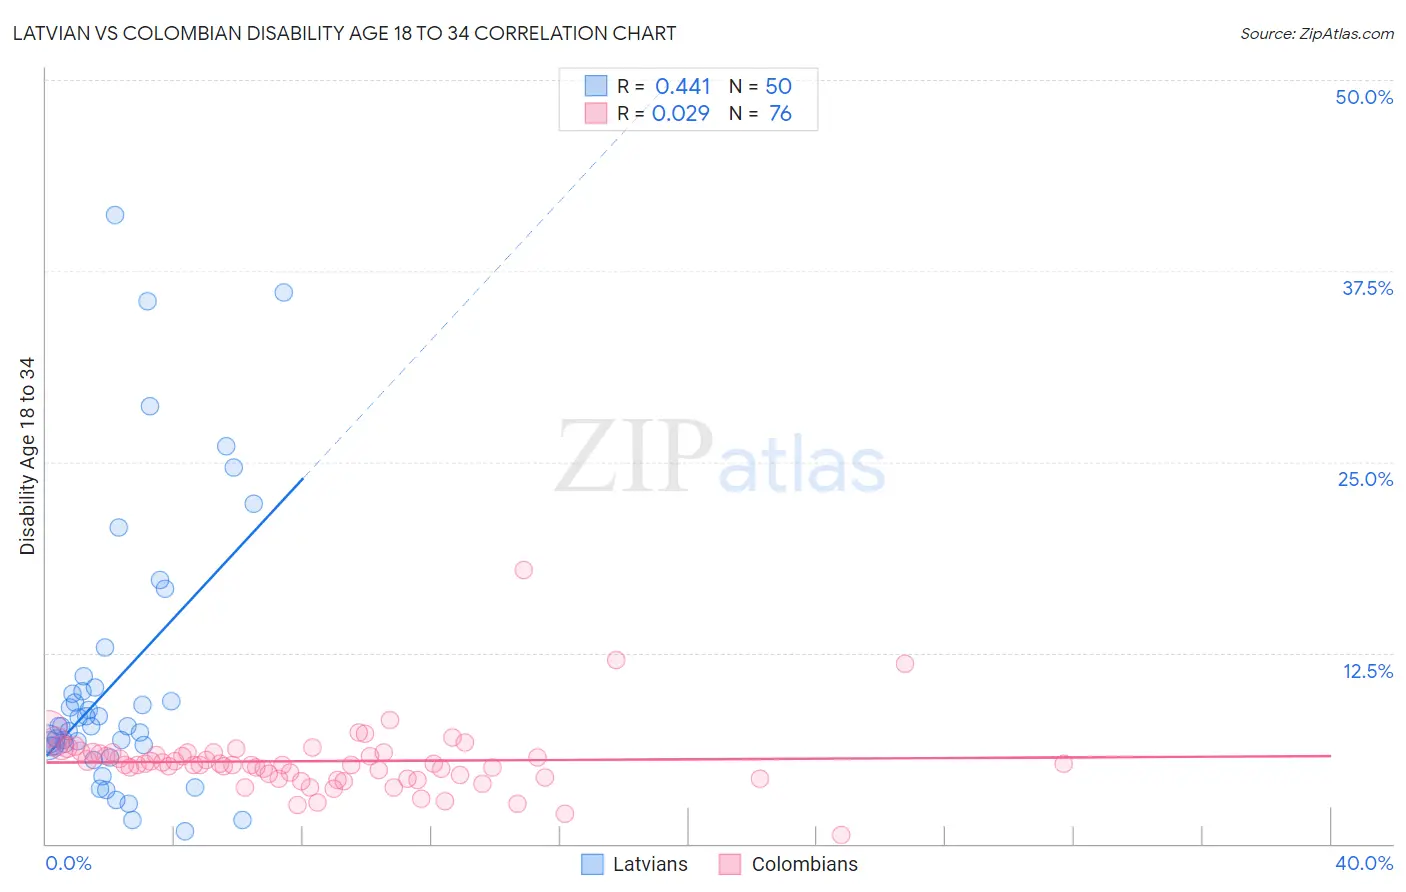
Latvian vs Colombian Disability Age 18 to 34 Correlation Chart

The statistical analysis conducted on geographies consisting of 220,392,708 people shows a moderate positive correlation between the proportion of Latvians and percentage of population with a disability between the ages 18 and 35 in the United States with a correlation coefficient (R) of 0.441 and weighted average of 6.8%. Similarly, the statistical analysis conducted on geographies consisting of 418,761,238 people shows no correlation between the proportion of Colombians and percentage of population with a disability between the ages 18 and 35 in the United States with a correlation coefficient (R) of 0.029 and weighted average of 5.9%, a difference of 16.8%.
Latvian vs Colombian Disability Age 18 to 34

Disability Age 18 to 34 Correlation Summary

MeasurementLatvianColombian
Minimum0.83%0.61%
Maximum41.2%17.9%
Range40.3%17.3%
Mean10.8%5.4%
Median7.7%5.2%
Interquartile 25% (IQ1)6.4%4.3%
Interquartile 75% (IQ3)10.2%6.0%
Interquartile Range (IQR)3.8%1.7%
Standard Deviation (Sample)9.2%2.2%
Standard Deviation (Population)9.1%2.2%

Similar Demographics by Disability Age 18 to 34

Demographics Similar to Latvians by Disability Age 18 to 34

In terms of disability age 18 to 34, the demographic groups most similar to Latvians are Immigrants from Burma/Myanmar (6.8%, a difference of 0.20%), Immigrants from Norway (6.8%, a difference of 0.20%), Immigrants from Scotland (6.8%, a difference of 0.22%), Mexican (6.8%, a difference of 0.24%), and Japanese (6.8%, a difference of 0.27%).
DemographicsRating | RankDisability Age 18 to 34
Hispanics or Latinos
13.8
/100
|
#203
Poor
6.8%
Immigrants | Bosnia and Herzegovina
13.6
/100
|
#204
Poor
6.8%
Lebanese
13.3
/100
|
#205
Poor
6.8%
Japanese
12.8
/100
|
#206
Poor
6.8%
Mexicans
12.6
/100
|
#207
Poor
6.8%
Immigrants | Scotland
12.4
/100
|
#208
Poor
6.8%
Immigrants | Burma/Myanmar
12.3
/100
|
#209
Poor
6.8%
Latvians
11.1
/100
|
#210
Poor
6.8%
Immigrants | Norway
10.0
/100
|
#211
Tragic
6.8%
Luxembourgers
9.4
/100
|
#212
Tragic
6.9%
Immigrants | Western Europe
9.1
/100
|
#213
Tragic
6.9%
Serbians
8.2
/100
|
#214
Tragic
6.9%
Immigrants | Thailand
7.5
/100
|
#215
Tragic
6.9%
Sudanese
7.0
/100
|
#216
Tragic
6.9%
Immigrants | Kenya
6.9
/100
|
#217
Tragic
6.9%

Demographics Similar to Colombians by Disability Age 18 to 34

In terms of disability age 18 to 34, the demographic groups most similar to Colombians are South American (5.9%, a difference of 0.020%), Immigrants from Asia (5.9%, a difference of 0.040%), Immigrants from Peru (5.9%, a difference of 0.17%), Nicaraguan (5.8%, a difference of 0.22%), and Immigrants from Korea (5.9%, a difference of 0.30%).
DemographicsRating | RankDisability Age 18 to 34
Immigrants | Lithuania
99.9
/100
|
#35
Exceptional
5.8%
Ecuadorians
99.9
/100
|
#36
Exceptional
5.8%
Armenians
99.9
/100
|
#37
Exceptional
5.8%
Immigrants | South America
99.9
/100
|
#38
Exceptional
5.8%
Asians
99.9
/100
|
#39
Exceptional
5.8%
Bolivians
99.9
/100
|
#40
Exceptional
5.8%
Nicaraguans
99.9
/100
|
#41
Exceptional
5.8%
Colombians
99.8
/100
|
#42
Exceptional
5.9%
South Americans
99.8
/100
|
#43
Exceptional
5.9%
Immigrants | Asia
99.8
/100
|
#44
Exceptional
5.9%
Immigrants | Peru
99.8
/100
|
#45
Exceptional
5.9%
Immigrants | Korea
99.8
/100
|
#46
Exceptional
5.9%
Immigrants | Egypt
99.8
/100
|
#47
Exceptional
5.9%
Immigrants | Trinidad and Tobago
99.8
/100
|
#48
Exceptional
5.9%
Immigrants | Belarus
99.8
/100
|
#49
Exceptional
5.9%