Japanese vs Immigrants from Africa Hearing Disability
COMPARE
Japanese
Immigrants from Africa
Hearing Disability
Hearing Disability Comparison
Japanese
Immigrants from Africa
3.0%
HEARING DISABILITY
46.0/ 100
METRIC RATING
178th/ 347
METRIC RANK
2.7%
HEARING DISABILITY
98.0/ 100
METRIC RATING
68th/ 347
METRIC RANK
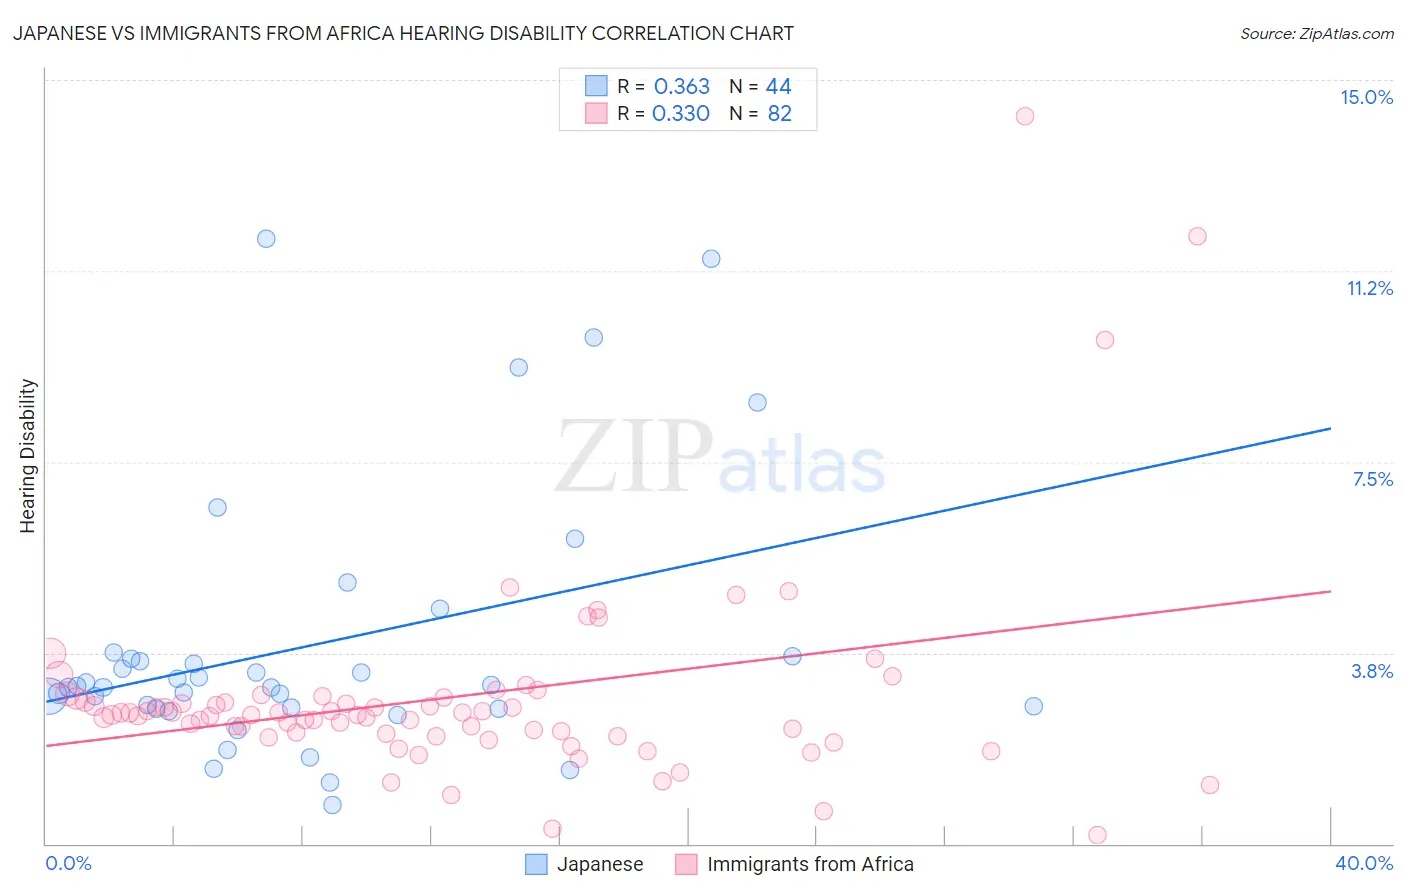
Japanese vs Immigrants from Africa Hearing Disability Correlation Chart
The statistical analysis conducted on geographies consisting of 249,105,269 people shows a mild positive correlation between the proportion of Japanese and percentage of population with hearing disability in the United States with a correlation coefficient (R) of 0.363 and weighted average of 3.0%. Similarly, the statistical analysis conducted on geographies consisting of 469,129,407 people shows a mild positive correlation between the proportion of Immigrants from Africa and percentage of population with hearing disability in the United States with a correlation coefficient (R) of 0.330 and weighted average of 2.7%, a difference of 10.4%.
Hearing Disability Correlation Summary
| Measurement | Japanese | Immigrants from Africa |
| Minimum | 0.75% | 0.17% |
| Maximum | 11.9% | 14.3% |
| Range | 11.1% | 14.1% |
| Mean | 3.9% | 2.9% |
| Median | 3.1% | 2.5% |
| Interquartile 25% (IQ1) | 2.7% | 2.2% |
| Interquartile 75% (IQ3) | 3.7% | 2.9% |
| Interquartile Range (IQR) | 1.0% | 0.70% |
| Standard Deviation (Sample) | 2.6% | 2.0% |
| Standard Deviation (Population) | 2.6% | 2.0% |
Similar Demographics by Hearing Disability
Demographics Similar to Japanese by Hearing Disability
In terms of hearing disability, the demographic groups most similar to Japanese are Immigrants from Philippines (3.0%, a difference of 0.040%), Panamanian (3.0%, a difference of 0.10%), Immigrants from Romania (3.0%, a difference of 0.23%), Immigrants from Moldova (3.0%, a difference of 0.28%), and Immigrants from Sweden (3.0%, a difference of 0.34%).
| Demographics | Rating | Rank | Hearing Disability |
| Immigrants | Ukraine | 56.6 /100 | #171 | Average 3.0% |
| Armenians | 56.0 /100 | #172 | Average 3.0% |
| Immigrants | Serbia | 51.1 /100 | #173 | Average 3.0% |
| Indonesians | 50.0 /100 | #174 | Average 3.0% |
| Immigrants | Romania | 48.4 /100 | #175 | Average 3.0% |
| Panamanians | 47.0 /100 | #176 | Average 3.0% |
| Immigrants | Philippines | 46.4 /100 | #177 | Average 3.0% |
| Japanese | 46.0 /100 | #178 | Average 3.0% |
| Immigrants | Moldova | 43.1 /100 | #179 | Average 3.0% |
| Immigrants | Sweden | 42.4 /100 | #180 | Average 3.0% |
| Immigrants | Belgium | 41.5 /100 | #181 | Average 3.0% |
| Immigrants | Italy | 41.1 /100 | #182 | Average 3.0% |
| Bulgarians | 39.7 /100 | #183 | Fair 3.0% |
| Immigrants | Ireland | 37.4 /100 | #184 | Fair 3.0% |
| Immigrants | Southern Europe | 35.3 /100 | #185 | Fair 3.0% |
Demographics Similar to Immigrants from Africa by Hearing Disability
In terms of hearing disability, the demographic groups most similar to Immigrants from Africa are Nicaraguan (2.7%, a difference of 0.040%), Egyptian (2.7%, a difference of 0.13%), Peruvian (2.7%, a difference of 0.27%), Central American (2.7%, a difference of 0.32%), and Immigrants from Belize (2.7%, a difference of 0.36%).
| Demographics | Rating | Rank | Hearing Disability |
| Immigrants | Uzbekistan | 98.4 /100 | #61 | Exceptional 2.7% |
| Immigrants | Colombia | 98.4 /100 | #62 | Exceptional 2.7% |
| Indians (Asian) | 98.4 /100 | #63 | Exceptional 2.7% |
| Immigrants | Sri Lanka | 98.4 /100 | #64 | Exceptional 2.7% |
| Immigrants | Nepal | 98.3 /100 | #65 | Exceptional 2.7% |
| Immigrants | Belize | 98.2 /100 | #66 | Exceptional 2.7% |
| Egyptians | 98.1 /100 | #67 | Exceptional 2.7% |
| Immigrants | Africa | 98.0 /100 | #68 | Exceptional 2.7% |
| Nicaraguans | 97.9 /100 | #69 | Exceptional 2.7% |
| Peruvians | 97.7 /100 | #70 | Exceptional 2.7% |
| Central Americans | 97.7 /100 | #71 | Exceptional 2.7% |
| Afghans | 97.6 /100 | #72 | Exceptional 2.7% |
| Argentineans | 97.5 /100 | #73 | Exceptional 2.7% |
| Immigrants | Korea | 97.5 /100 | #74 | Exceptional 2.7% |
| Immigrants | Saudi Arabia | 97.5 /100 | #75 | Exceptional 2.7% |