Iranian vs Immigrants from Germany Male Disability
COMPARE
Iranian
Immigrants from Germany
Male Disability
Male Disability Comparison
Iranians
Immigrants from Germany
9.7%
MALE DISABILITY
100.0/ 100
METRIC RATING
13th/ 347
METRIC RANK
12.3%
MALE DISABILITY
0.1/ 100
METRIC RATING
267th/ 347
METRIC RANK
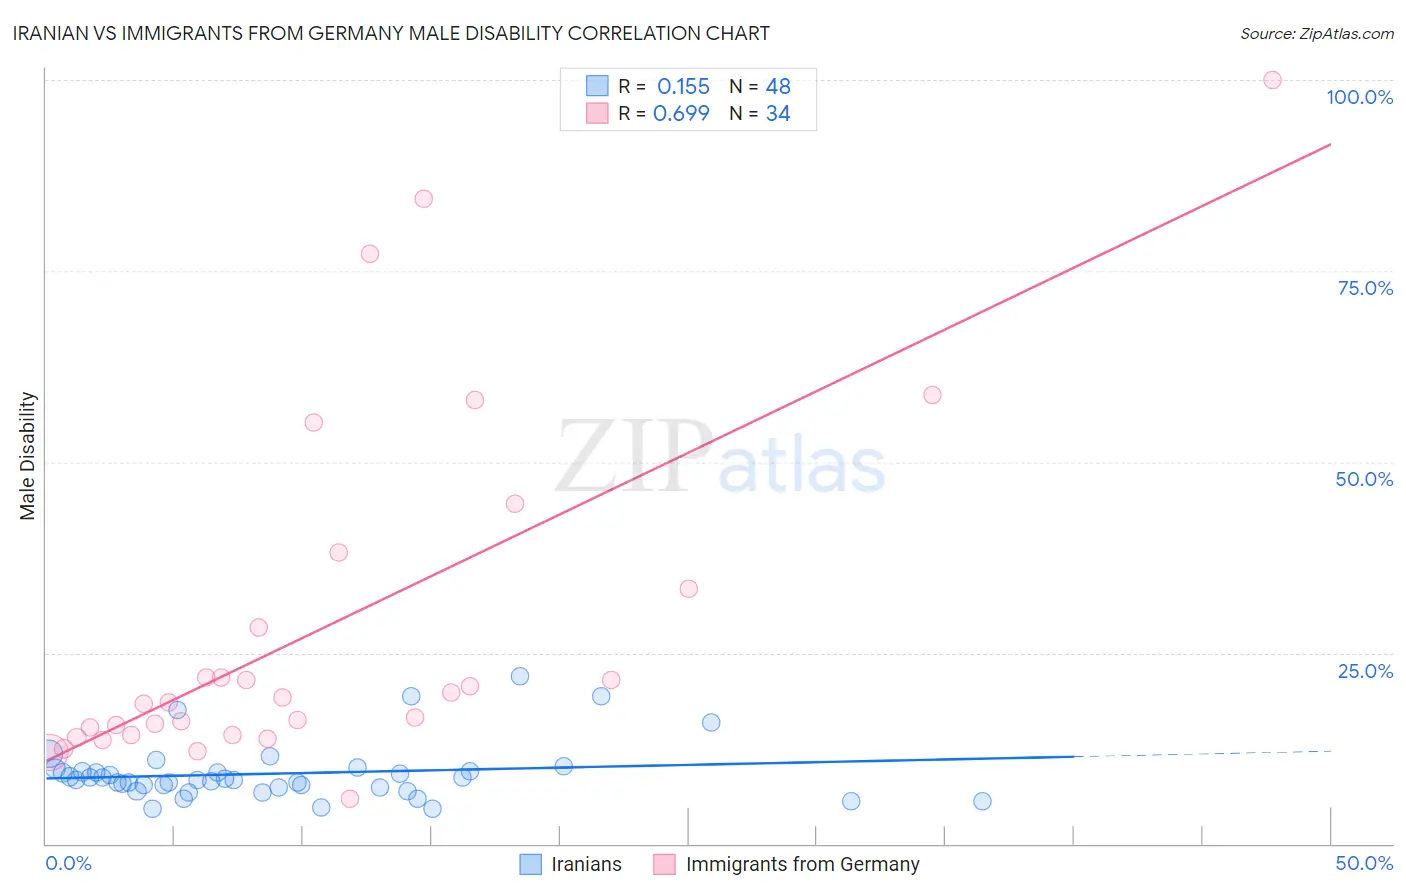
Iranian vs Immigrants from Germany Male Disability Correlation Chart
The statistical analysis conducted on geographies consisting of 316,851,194 people shows a poor positive correlation between the proportion of Iranians and percentage of males with a disability in the United States with a correlation coefficient (R) of 0.155 and weighted average of 9.7%. Similarly, the statistical analysis conducted on geographies consisting of 463,850,065 people shows a significant positive correlation between the proportion of Immigrants from Germany and percentage of males with a disability in the United States with a correlation coefficient (R) of 0.699 and weighted average of 12.3%, a difference of 27.0%.
Male Disability Correlation Summary
| Measurement | Iranian | Immigrants from Germany |
| Minimum | 4.5% | 5.9% |
| Maximum | 21.9% | 100.0% |
| Range | 17.4% | 94.1% |
| Mean | 9.2% | 28.5% |
| Median | 8.4% | 18.8% |
| Interquartile 25% (IQ1) | 7.4% | 14.2% |
| Interquartile 75% (IQ3) | 9.4% | 33.3% |
| Interquartile Range (IQR) | 2.1% | 19.1% |
| Standard Deviation (Sample) | 3.7% | 23.0% |
| Standard Deviation (Population) | 3.7% | 22.7% |
Similar Demographics by Male Disability
Demographics Similar to Iranians by Male Disability
In terms of male disability, the demographic groups most similar to Iranians are Immigrants from Iran (9.7%, a difference of 0.10%), Bolivian (9.6%, a difference of 0.23%), Immigrants from Eastern Asia (9.6%, a difference of 0.46%), Indian (Asian) (9.7%, a difference of 0.55%), and Immigrants from Israel (9.6%, a difference of 1.0%).
| Demographics | Rating | Rank | Male Disability |
| Immigrants | South Central Asia | 100.0 /100 | #6 | Exceptional 9.4% |
| Immigrants | Bolivia | 100.0 /100 | #7 | Exceptional 9.5% |
| Immigrants | China | 100.0 /100 | #8 | Exceptional 9.5% |
| Immigrants | Singapore | 100.0 /100 | #9 | Exceptional 9.5% |
| Immigrants | Israel | 100.0 /100 | #10 | Exceptional 9.6% |
| Immigrants | Eastern Asia | 100.0 /100 | #11 | Exceptional 9.6% |
| Bolivians | 100.0 /100 | #12 | Exceptional 9.6% |
| Iranians | 100.0 /100 | #13 | Exceptional 9.7% |
| Immigrants | Iran | 100.0 /100 | #14 | Exceptional 9.7% |
| Indians (Asian) | 100.0 /100 | #15 | Exceptional 9.7% |
| Okinawans | 100.0 /100 | #16 | Exceptional 9.8% |
| Immigrants | Korea | 100.0 /100 | #17 | Exceptional 9.8% |
| Immigrants | Pakistan | 100.0 /100 | #18 | Exceptional 9.8% |
| Immigrants | Sri Lanka | 100.0 /100 | #19 | Exceptional 10.0% |
| Asians | 100.0 /100 | #20 | Exceptional 10.0% |
Demographics Similar to Immigrants from Germany by Male Disability
In terms of male disability, the demographic groups most similar to Immigrants from Germany are Hawaiian (12.3%, a difference of 0.050%), Immigrants from Portugal (12.3%, a difference of 0.070%), Portuguese (12.3%, a difference of 0.13%), Czechoslovakian (12.3%, a difference of 0.13%), and Spaniard (12.3%, a difference of 0.21%).
| Demographics | Rating | Rank | Male Disability |
| Swedes | 0.3 /100 | #260 | Tragic 12.1% |
| Slavs | 0.2 /100 | #261 | Tragic 12.2% |
| Norwegians | 0.2 /100 | #262 | Tragic 12.2% |
| Canadians | 0.2 /100 | #263 | Tragic 12.2% |
| Nepalese | 0.2 /100 | #264 | Tragic 12.2% |
| Immigrants | Portugal | 0.1 /100 | #265 | Tragic 12.3% |
| Hawaiians | 0.1 /100 | #266 | Tragic 12.3% |
| Immigrants | Germany | 0.1 /100 | #267 | Tragic 12.3% |
| Portuguese | 0.1 /100 | #268 | Tragic 12.3% |
| Czechoslovakians | 0.1 /100 | #269 | Tragic 12.3% |
| Spaniards | 0.1 /100 | #270 | Tragic 12.3% |
| Scandinavians | 0.1 /100 | #271 | Tragic 12.3% |
| Hmong | 0.0 /100 | #272 | Tragic 12.5% |
| Native Hawaiians | 0.0 /100 | #273 | Tragic 12.5% |
| Hopi | 0.0 /100 | #274 | Tragic 12.5% |