Inupiat vs Paiute Disability Age 35 to 64
COMPARE
Inupiat
Paiute
Disability Age 35 to 64
Disability Age 35 to 64 Comparison
Inupiat
Paiute
14.1%
DISABILITY AGE 35 TO 64
0.0/ 100
METRIC RATING
308th/ 347
METRIC RANK
14.3%
DISABILITY AGE 35 TO 64
0.0/ 100
METRIC RATING
312th/ 347
METRIC RANK
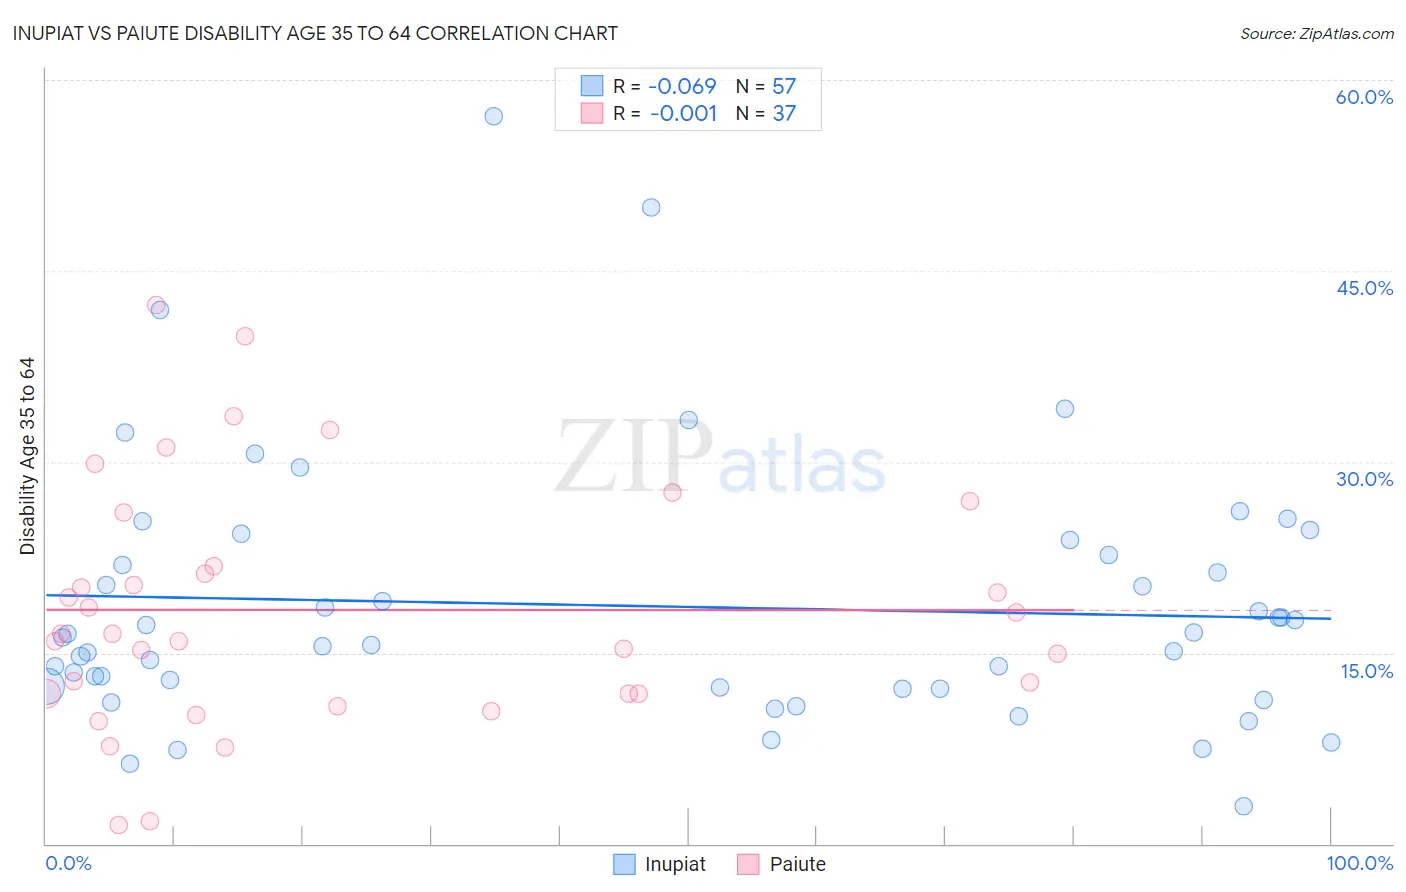
Inupiat vs Paiute Disability Age 35 to 64 Correlation Chart
The statistical analysis conducted on geographies consisting of 96,326,282 people shows a slight negative correlation between the proportion of Inupiat and percentage of population with a disability between the ages 34 and 64 in the United States with a correlation coefficient (R) of -0.069 and weighted average of 14.1%. Similarly, the statistical analysis conducted on geographies consisting of 58,391,791 people shows no correlation between the proportion of Paiute and percentage of population with a disability between the ages 34 and 64 in the United States with a correlation coefficient (R) of -0.001 and weighted average of 14.3%, a difference of 1.6%.
Disability Age 35 to 64 Correlation Summary
| Measurement | Inupiat | Paiute |
| Minimum | 2.9% | 1.4% |
| Maximum | 57.1% | 42.3% |
| Range | 54.2% | 40.9% |
| Mean | 18.7% | 18.4% |
| Median | 16.2% | 16.5% |
| Interquartile 25% (IQ1) | 12.2% | 11.8% |
| Interquartile 75% (IQ3) | 23.3% | 23.9% |
| Interquartile Range (IQR) | 11.1% | 12.2% |
| Standard Deviation (Sample) | 10.3% | 9.6% |
| Standard Deviation (Population) | 10.2% | 9.5% |
Demographics Similar to Inupiat and Paiute by Disability Age 35 to 64
In terms of disability age 35 to 64, the demographic groups most similar to Inupiat are Blackfeet (14.1%, a difference of 0.030%), Cree (14.1%, a difference of 0.070%), Immigrants from Yemen (14.0%, a difference of 0.19%), Cape Verdean (14.1%, a difference of 0.54%), and American (13.9%, a difference of 1.1%). Similarly, the demographic groups most similar to Paiute are Immigrants from the Azores (14.3%, a difference of 0.15%), Iroquois (14.4%, a difference of 0.44%), Cape Verdean (14.1%, a difference of 1.1%), Shoshone (14.5%, a difference of 1.2%), and Alaska Native (14.5%, a difference of 1.2%).
| Demographics | Rating | Rank | Disability Age 35 to 64 |
| Delaware | 0.0 /100 | #300 | Tragic 13.7% |
| French American Indians | 0.0 /100 | #301 | Tragic 13.7% |
| Aleuts | 0.0 /100 | #302 | Tragic 13.8% |
| Sioux | 0.0 /100 | #303 | Tragic 13.9% |
| Hopi | 0.0 /100 | #304 | Tragic 13.9% |
| Americans | 0.0 /100 | #305 | Tragic 13.9% |
| Immigrants | Yemen | 0.0 /100 | #306 | Tragic 14.0% |
| Blackfeet | 0.0 /100 | #307 | Tragic 14.1% |
| Inupiat | 0.0 /100 | #308 | Tragic 14.1% |
| Cree | 0.0 /100 | #309 | Tragic 14.1% |
| Cape Verdeans | 0.0 /100 | #310 | Tragic 14.1% |
| Immigrants | Azores | 0.0 /100 | #311 | Tragic 14.3% |
| Paiute | 0.0 /100 | #312 | Tragic 14.3% |
| Iroquois | 0.0 /100 | #313 | Tragic 14.4% |
| Shoshone | 0.0 /100 | #314 | Tragic 14.5% |
| Alaska Natives | 0.0 /100 | #315 | Tragic 14.5% |
| Osage | 0.0 /100 | #316 | Tragic 14.5% |
| Crow | 0.0 /100 | #317 | Tragic 14.6% |
| Ottawa | 0.0 /100 | #318 | Tragic 14.6% |
| Immigrants | Cabo Verde | 0.0 /100 | #319 | Tragic 14.7% |
| Blacks/African Americans | 0.0 /100 | #320 | Tragic 14.7% |