Immigrants vs Bermudan Disability Age Over 75

COMPARE

Immigrants
Race
Ancestry
AfghanAfricanAlaska NativeAlaskan AthabascanAlbanianAleutAlsatianAmericanApacheArabArapahoArgentineanArmenianAssyrian/Chaldean/SyriacAustralianAustrianBahamianBangladeshiBarbadianBasqueBelgianBelizeanBhutaneseBlackfeetBolivianBrazilianBritishBritish West IndianBulgarianBurmeseCajunCambodianCanadianCape VerdeanCarpatho RusynCelticCentral AmericanCentral American IndianCherokeeCheyenneChickasawChileanChineseChippewaChoctawColombianColvilleComancheCosta RicanCreeCreekCroatianCrowCubanCypriotCzechCzechoslovakianDanishDelawareDominicanDutchDutch West IndianEastern EuropeanEcuadorianEgyptianEnglishEstonianEthiopianEuropeanFijianFilipinoFinnishFrenchFrench American IndianFrench CanadianGermanGerman RussianGhanaianGreekGuamanian/ChamorroGuatemalanGuyaneseHaitianHmongHonduranHopiHoumaHungarianIcelanderIndian (Asian)IndonesianInupiatIranianIraqiIrishIroquoisIsraeliItalianJamaicanJapaneseJordanianKenyanKiowaKoreanLaotianLatvianLebaneseLiberianLithuanianLumbeeLuxembourgerMacedonianMalaysianMalteseMarshalleseMenomineeMexicanMexican American IndianMongolianMoroccanNative HawaiianNavajoNepaleseNew ZealanderNicaraguanNigerianNorthern EuropeanNorwegianOkinawanOsageOttawaPaiutePakistaniPalestinianPanamanianParaguayanPennsylvania GermanPeruvianPimaPolishPortuguesePotawatomiPuebloPuerto RicanPuget Sound SalishRomanianRussianSalvadoranSamoanScandinavianScotch-IrishScottishSeminoleSenegaleseSerbianShoshoneSierra LeoneanSiouxSlavicSlovakSloveneSomaliSouth AfricanSouth AmericanSouth American IndianSoviet UnionSpaniardSpanishSpanish AmericanSpanish American IndianSri LankanSubsaharan AfricanSudaneseSwedishSwissSyrianTaiwaneseThaiTlingit-HaidaTohono O'OdhamTonganTrinidadian and TobagonianTsimshianTurkishU.S. Virgin IslanderUgandanUkrainianUruguayanUteVenezuelanVietnameseWelshWest IndianYakamaYaquiYugoslavianYumanYup'ikZimbabwean
Immigration
NonimmigrantsImmigrantsAfghanistanAfricaAlbaniaArgentinaArmeniaAsiaAustraliaAustriaBahamasBangladeshBarbadosBelarusBelgiumBelizeBoliviaBosnia and HerzegovinaBrazilBulgariaBurma/MyanmarCabo VerdeCambodiaCameroonCanadaCaribbeanCentral AmericaChileChinaColombiaCongoCosta RicaCroatiaCubaCzechoslovakiaDenmarkDominicaDominican RepublicEastern AfricaEastern AsiaEastern EuropeEcuadorEgyptEl SalvadorEnglandEritreaEthiopiaEuropeFijiFranceGermanyGhanaGreeceGrenadaGuatemalaGuyanaHaitiHondurasHong KongHungaryIndiaIndonesiaIranIraqIrelandIsraelItalyJamaicaJapanJordanKazakhstanKenyaKoreaKuwaitLaosLatin AmericaLatviaLebanonLiberiaLithuaniaMalaysiaMexicoMicronesiaMiddle AfricaMoldovaMoroccoNepalNetherlandsNicaraguaNigeriaNorth AmericaNorth MacedoniaNorthern AfricaNorthern EuropeNorwayOceaniaPakistanPanamaPeruPhilippinesPolandPortugalRomaniaRussiaSaudi ArabiaScotlandSenegalSerbiaSierra LeoneSingaporeSomaliaSouth AfricaSouth AmericaSouth Central AsiaSouth Eastern AsiaSouthern EuropeSpainSri LankaSt. Vincent and the GrenadinesSudanSwedenSwitzerlandSyriaTaiwanThailandTrinidad and TobagoTurkeyUgandaUkraineUruguayUzbekistanVenezuelaVietnamWest IndiesWestern AfricaWestern AsiaWestern EuropeYemenZaireZimbabweAzores
Bermudan
Race
Ancestry
AfghanAfricanAlaska NativeAlaskan AthabascanAlbanianAleutAlsatianAmericanApacheArabArapahoArgentineanArmenianAssyrian/Chaldean/SyriacAustralianAustrianBahamianBangladeshiBarbadianBasqueBelgianBelizeanBermudanBhutaneseBlackfeetBolivianBrazilianBritishBritish West IndianBulgarianBurmeseCajunCambodianCanadianCape VerdeanCarpatho RusynCelticCentral AmericanCentral American IndianCherokeeCheyenneChickasawChileanChineseChippewaChoctawColombianColvilleComancheCosta RicanCreeCreekCroatianCrowCubanCypriotCzechCzechoslovakianDanishDelawareDominicanDutchDutch West IndianEastern EuropeanEcuadorianEgyptianEnglishEstonianEthiopianEuropeanFijianFilipinoFinnishFrenchFrench American IndianFrench CanadianGermanGerman RussianGhanaianGreekGuamanian/ChamorroGuatemalanGuyaneseHaitianHmongHonduranHopiHoumaHungarianIcelanderIndian (Asian)IndonesianInupiatIranianIraqiIrishIroquoisIsraeliItalianJamaicanJapaneseJordanianKenyanKiowaKoreanLaotianLatvianLebaneseLiberianLithuanianLumbeeLuxembourgerMacedonianMalaysianMalteseMarshalleseMenomineeMexicanMexican American IndianMongolianMoroccanNative HawaiianNavajoNepaleseNew ZealanderNicaraguanNigerianNorthern EuropeanNorwegianOkinawanOsageOttawaPaiutePakistaniPalestinianPanamanianParaguayanPennsylvania GermanPeruvianPimaPolishPortuguesePotawatomiPuebloPuerto RicanPuget Sound SalishRomanianRussianSalvadoranSamoanScandinavianScotch-IrishScottishSeminoleSenegaleseSerbianShoshoneSierra LeoneanSiouxSlavicSlovakSloveneSomaliSouth AfricanSouth AmericanSouth American IndianSoviet UnionSpaniardSpanishSpanish AmericanSpanish American IndianSri LankanSubsaharan AfricanSudaneseSwedishSwissSyrianTaiwaneseThaiTlingit-HaidaTohono O'OdhamTonganTrinidadian and TobagonianTsimshianTurkishU.S. Virgin IslanderUgandanUkrainianUruguayanUteVenezuelanVietnameseWelshWest IndianYakamaYaquiYugoslavianYumanYup'ikZimbabwean
Immigration
NonimmigrantsAfghanistanAfricaAlbaniaArgentinaArmeniaAsiaAustraliaAustriaBahamasBangladeshBarbadosBelarusBelgiumBelizeBoliviaBosnia and HerzegovinaBrazilBulgariaBurma/MyanmarCabo VerdeCambodiaCameroonCanadaCaribbeanCentral AmericaChileChinaColombiaCongoCosta RicaCroatiaCubaCzechoslovakiaDenmarkDominicaDominican RepublicEastern AfricaEastern AsiaEastern EuropeEcuadorEgyptEl SalvadorEnglandEritreaEthiopiaEuropeFijiFranceGermanyGhanaGreeceGrenadaGuatemalaGuyanaHaitiHondurasHong KongHungaryIndiaIndonesiaIranIraqIrelandIsraelItalyJamaicaJapanJordanKazakhstanKenyaKoreaKuwaitLaosLatin AmericaLatviaLebanonLiberiaLithuaniaMalaysiaMexicoMicronesiaMiddle AfricaMoldovaMoroccoNepalNetherlandsNicaraguaNigeriaNorth AmericaNorth MacedoniaNorthern AfricaNorthern EuropeNorwayOceaniaPakistanPanamaPeruPhilippinesPolandPortugalRomaniaRussiaSaudi ArabiaScotlandSenegalSerbiaSierra LeoneSingaporeSomaliaSouth AfricaSouth AmericaSouth Central AsiaSouth Eastern AsiaSouthern EuropeSpainSri LankaSt. Vincent and the GrenadinesSudanSwedenSwitzerlandSyriaTaiwanThailandTrinidad and TobagoTurkeyUgandaUkraineUruguayUzbekistanVenezuelaVietnamWest IndiesWestern AfricaWestern AsiaWestern EuropeYemenZaireZimbabweAzores
Disability Age Over 75
Income
Poverty
Unemployment
Labor Participation
Family Structure
Vehicle Availability
Education Level
Disability

Disability Age Over 75 Comparison

Immigrants

Bermudans

Tragic
Excellent
48.2%
DISABILITY AGE OVER 75
4.3/ 100
METRIC RATING
231st/ 347
METRIC RANK
46.9%
DISABILITY AGE OVER 75
85.6/ 100
METRIC RATING
143rd/ 347
METRIC RANK

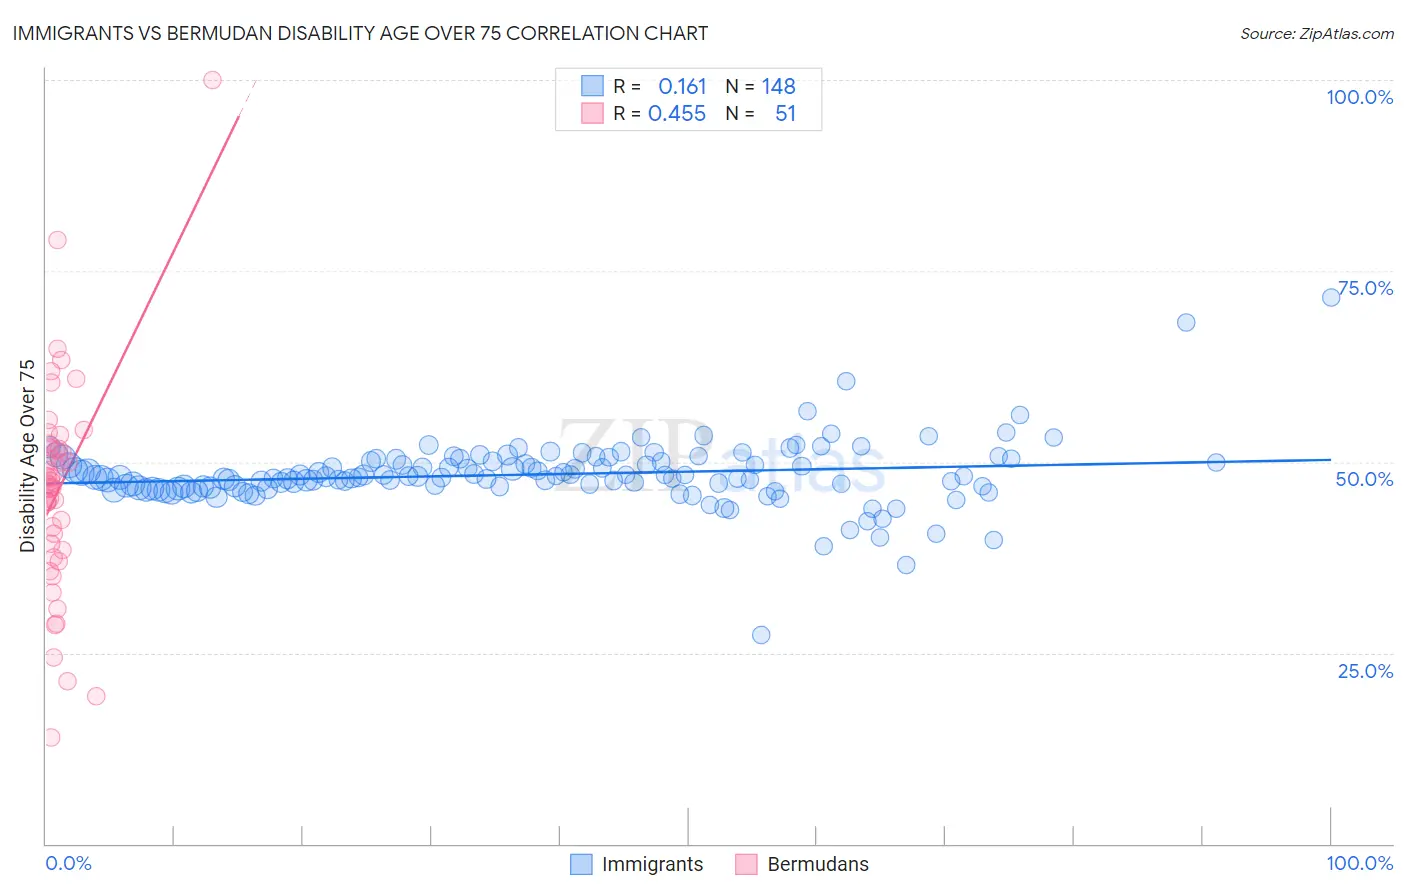
Immigrants vs Bermudan Disability Age Over 75 Correlation Chart

The statistical analysis conducted on geographies consisting of 575,317,418 people shows a poor positive correlation between the proportion of Immigrants and percentage of population with a disability over the age of 75 in the United States with a correlation coefficient (R) of 0.161 and weighted average of 48.2%. Similarly, the statistical analysis conducted on geographies consisting of 55,716,155 people shows a moderate positive correlation between the proportion of Bermudans and percentage of population with a disability over the age of 75 in the United States with a correlation coefficient (R) of 0.455 and weighted average of 46.9%, a difference of 2.8%.
Immigrants vs Bermudan Disability Age Over 75

Disability Age Over 75 Correlation Summary

MeasurementImmigrantsBermudan
Minimum27.4%13.9%
Maximum71.4%100.0%
Range44.1%86.1%
Mean48.3%46.3%
Median48.0%47.0%
Interquartile 25% (IQ1)46.7%38.5%
Interquartile 75% (IQ3)50.1%52.0%
Interquartile Range (IQR)3.3%13.5%
Standard Deviation (Sample)4.4%14.3%
Standard Deviation (Population)4.4%14.2%

Similar Demographics by Disability Age Over 75

Demographics Similar to Immigrants by Disability Age Over 75

In terms of disability age over 75, the demographic groups most similar to Immigrants are Taiwanese (48.2%, a difference of 0.010%), Indonesian (48.2%, a difference of 0.010%), Cree (48.2%, a difference of 0.020%), Subsaharan African (48.2%, a difference of 0.080%), and Hmong (48.2%, a difference of 0.080%).
DemographicsRating | RankDisability Age Over 75
Liberians
6.7
/100
|
#224
Tragic
48.0%
Spanish
6.5
/100
|
#225
Tragic
48.0%
Immigrants | Nonimmigrants
6.5
/100
|
#226
Tragic
48.0%
Zimbabweans
6.4
/100
|
#227
Tragic
48.1%
Immigrants | Liberia
5.9
/100
|
#228
Tragic
48.1%
Spaniards
5.7
/100
|
#229
Tragic
48.1%
Taiwanese
4.4
/100
|
#230
Tragic
48.2%
Immigrants | Immigrants
4.3
/100
|
#231
Tragic
48.2%
Indonesians
4.2
/100
|
#232
Tragic
48.2%
Cree
4.2
/100
|
#233
Tragic
48.2%
Sub-Saharan Africans
3.8
/100
|
#234
Tragic
48.2%
Hmong
3.8
/100
|
#235
Tragic
48.2%
Immigrants | Nicaragua
3.2
/100
|
#236
Tragic
48.2%
Immigrants | St. Vincent and the Grenadines
3.2
/100
|
#237
Tragic
48.2%
Nicaraguans
3.0
/100
|
#238
Tragic
48.3%

Demographics Similar to Bermudans by Disability Age Over 75

In terms of disability age over 75, the demographic groups most similar to Bermudans are Venezuelan (46.9%, a difference of 0.020%), Peruvian (46.8%, a difference of 0.040%), Costa Rican (46.9%, a difference of 0.050%), Guyanese (46.9%, a difference of 0.060%), and Lebanese (46.8%, a difference of 0.070%).
DemographicsRating | RankDisability Age Over 75
Immigrants | Venezuela
88.6
/100
|
#136
Excellent
46.8%
Immigrants | Uganda
88.5
/100
|
#137
Excellent
46.8%
Immigrants | Bosnia and Herzegovina
88.5
/100
|
#138
Excellent
46.8%
Yugoslavians
88.5
/100
|
#139
Excellent
46.8%
Immigrants | Costa Rica
87.4
/100
|
#140
Excellent
46.8%
Lebanese
87.0
/100
|
#141
Excellent
46.8%
Peruvians
86.5
/100
|
#142
Excellent
46.8%
Bermudans
85.6
/100
|
#143
Excellent
46.9%
Venezuelans
85.0
/100
|
#144
Excellent
46.9%
Costa Ricans
84.5
/100
|
#145
Excellent
46.9%
Guyanese
84.3
/100
|
#146
Excellent
46.9%
Immigrants | Peru
84.1
/100
|
#147
Excellent
46.9%
Asians
81.6
/100
|
#148
Excellent
46.9%
Welsh
81.3
/100
|
#149
Excellent
47.0%
Immigrants | Russia
79.3
/100
|
#150
Good
47.0%