Immigrants from Western Europe vs Puerto Rican Female Disability

COMPARE

Immigrants from Western Europe
Race
Ancestry
AfghanAfricanAlaska NativeAlaskan AthabascanAlbanianAleutAlsatianAmericanApacheArabArapahoArgentineanArmenianAssyrian/Chaldean/SyriacAustralianAustrianBahamianBangladeshiBarbadianBasqueBelgianBelizeanBermudanBhutaneseBlackfeetBolivianBrazilianBritishBritish West IndianBulgarianBurmeseCajunCambodianCanadianCape VerdeanCarpatho RusynCelticCentral AmericanCentral American IndianCherokeeCheyenneChickasawChileanChineseChippewaChoctawColombianColvilleComancheCosta RicanCreeCreekCroatianCrowCubanCypriotCzechCzechoslovakianDanishDelawareDominicanDutchDutch West IndianEastern EuropeanEcuadorianEgyptianEnglishEstonianEthiopianEuropeanFijianFilipinoFinnishFrenchFrench American IndianFrench CanadianGermanGerman RussianGhanaianGreekGuamanian/ChamorroGuatemalanGuyaneseHaitianHmongHonduranHopiHoumaHungarianIcelanderIndian (Asian)IndonesianInupiatIranianIraqiIrishIroquoisIsraeliItalianJamaicanJapaneseJordanianKenyanKiowaKoreanLaotianLatvianLebaneseLiberianLithuanianLumbeeLuxembourgerMacedonianMalaysianMalteseMarshalleseMenomineeMexicanMexican American IndianMongolianMoroccanNative HawaiianNavajoNepaleseNew ZealanderNicaraguanNigerianNorthern EuropeanNorwegianOkinawanOsageOttawaPaiutePakistaniPalestinianPanamanianParaguayanPennsylvania GermanPeruvianPimaPolishPortuguesePotawatomiPuebloPuget Sound SalishRomanianRussianSalvadoranSamoanScandinavianScotch-IrishScottishSeminoleSenegaleseSerbianShoshoneSierra LeoneanSiouxSlavicSlovakSloveneSomaliSouth AfricanSouth AmericanSouth American IndianSoviet UnionSpaniardSpanishSpanish AmericanSpanish American IndianSri LankanSubsaharan AfricanSudaneseSwedishSwissSyrianTaiwaneseThaiTlingit-HaidaTohono O'OdhamTonganTrinidadian and TobagonianTsimshianTurkishU.S. Virgin IslanderUgandanUkrainianUruguayanUteVenezuelanVietnameseWelshWest IndianYakamaYaquiYugoslavianYumanYup'ikZimbabwean
Immigration
NonimmigrantsImmigrantsAfghanistanAfricaAlbaniaArgentinaArmeniaAsiaAustraliaAustriaBahamasBangladeshBarbadosBelarusBelgiumBelizeBoliviaBosnia and HerzegovinaBrazilBulgariaBurma/MyanmarCabo VerdeCambodiaCameroonCanadaCaribbeanCentral AmericaChileChinaColombiaCongoCosta RicaCroatiaCubaCzechoslovakiaDenmarkDominicaDominican RepublicEastern AfricaEastern AsiaEastern EuropeEcuadorEgyptEl SalvadorEnglandEritreaEthiopiaEuropeFijiFranceGermanyGhanaGreeceGrenadaGuatemalaGuyanaHaitiHondurasHong KongHungaryIndiaIndonesiaIranIraqIrelandIsraelItalyJamaicaJapanJordanKazakhstanKenyaKoreaKuwaitLaosLatin AmericaLatviaLebanonLiberiaLithuaniaMalaysiaMexicoMicronesiaMiddle AfricaMoldovaMoroccoNepalNetherlandsNicaraguaNigeriaNorth AmericaNorth MacedoniaNorthern AfricaNorthern EuropeNorwayOceaniaPakistanPanamaPeruPhilippinesPolandPortugalRomaniaRussiaSaudi ArabiaScotlandSenegalSerbiaSierra LeoneSingaporeSomaliaSouth AfricaSouth AmericaSouth Central AsiaSouth Eastern AsiaSouthern EuropeSpainSri LankaSt. Vincent and the GrenadinesSudanSwedenSwitzerlandSyriaTaiwanThailandTrinidad and TobagoTurkeyUgandaUkraineUruguayUzbekistanVenezuelaVietnamWest IndiesWestern AfricaWestern AsiaWestern EuropeYemenZaireZimbabweAzores
Puerto Rican
Race
Ancestry
AfghanAfricanAlaska NativeAlaskan AthabascanAlbanianAleutAlsatianAmericanApacheArabArapahoArgentineanArmenianAssyrian/Chaldean/SyriacAustralianAustrianBahamianBangladeshiBarbadianBasqueBelgianBelizeanBermudanBhutaneseBlackfeetBolivianBrazilianBritishBritish West IndianBulgarianBurmeseCajunCambodianCanadianCape VerdeanCarpatho RusynCelticCentral AmericanCentral American IndianCherokeeCheyenneChickasawChileanChineseChippewaChoctawColombianColvilleComancheCosta RicanCreeCreekCroatianCrowCubanCypriotCzechCzechoslovakianDanishDelawareDominicanDutchDutch West IndianEastern EuropeanEcuadorianEgyptianEnglishEstonianEthiopianEuropeanFijianFilipinoFinnishFrenchFrench American IndianFrench CanadianGermanGerman RussianGhanaianGreekGuamanian/ChamorroGuatemalanGuyaneseHaitianHmongHonduranHopiHoumaHungarianIcelanderIndian (Asian)IndonesianInupiatIranianIraqiIrishIroquoisIsraeliItalianJamaicanJapaneseJordanianKenyanKiowaKoreanLaotianLatvianLebaneseLiberianLithuanianLumbeeLuxembourgerMacedonianMalaysianMalteseMarshalleseMenomineeMexicanMexican American IndianMongolianMoroccanNative HawaiianNavajoNepaleseNew ZealanderNicaraguanNigerianNorthern EuropeanNorwegianOkinawanOsageOttawaPaiutePakistaniPalestinianPanamanianParaguayanPennsylvania GermanPeruvianPimaPolishPortuguesePotawatomiPuebloPuerto RicanPuget Sound SalishRomanianRussianSalvadoranSamoanScandinavianScotch-IrishScottishSeminoleSenegaleseSerbianShoshoneSierra LeoneanSiouxSlavicSlovakSloveneSomaliSouth AfricanSouth AmericanSouth American IndianSoviet UnionSpaniardSpanishSpanish AmericanSpanish American IndianSri LankanSubsaharan AfricanSudaneseSwedishSwissSyrianTaiwaneseThaiTlingit-HaidaTohono O'OdhamTonganTrinidadian and TobagonianTsimshianTurkishU.S. Virgin IslanderUgandanUkrainianUruguayanUteVenezuelanVietnameseWelshWest IndianYakamaYaquiYugoslavianYumanYup'ikZimbabwean
Immigration
NonimmigrantsImmigrantsAfghanistanAfricaAlbaniaArgentinaArmeniaAsiaAustraliaAustriaBahamasBangladeshBarbadosBelarusBelgiumBelizeBoliviaBosnia and HerzegovinaBrazilBulgariaBurma/MyanmarCabo VerdeCambodiaCameroonCanadaCaribbeanCentral AmericaChileChinaColombiaCongoCosta RicaCroatiaCubaCzechoslovakiaDenmarkDominicaDominican RepublicEastern AfricaEastern AsiaEastern EuropeEcuadorEgyptEl SalvadorEnglandEritreaEthiopiaEuropeFijiFranceGermanyGhanaGreeceGrenadaGuatemalaGuyanaHaitiHondurasHong KongHungaryIndiaIndonesiaIranIraqIrelandIsraelItalyJamaicaJapanJordanKazakhstanKenyaKoreaKuwaitLaosLatin AmericaLatviaLebanonLiberiaLithuaniaMalaysiaMexicoMicronesiaMiddle AfricaMoldovaMoroccoNepalNetherlandsNicaraguaNigeriaNorth AmericaNorth MacedoniaNorthern AfricaNorthern EuropeNorwayOceaniaPakistanPanamaPeruPhilippinesPolandPortugalRomaniaRussiaSaudi ArabiaScotlandSenegalSerbiaSierra LeoneSingaporeSomaliaSouth AfricaSouth AmericaSouth Central AsiaSouth Eastern AsiaSouthern EuropeSpainSri LankaSt. Vincent and the GrenadinesSudanSwedenSwitzerlandSyriaTaiwanThailandTrinidad and TobagoTurkeyUgandaUkraineUruguayUzbekistanVenezuelaVietnamWest IndiesWestern AfricaWestern AsiaYemenZaireZimbabweAzores
Female Disability
Income
Poverty
Unemployment
Labor Participation
Family Structure
Vehicle Availability
Education Level
Disability

Female Disability Comparison

Immigrants from Western Europe

Puerto Ricans

Average
Tragic
12.2%
FEMALE DISABILITY
40.9/ 100
METRIC RATING
178th/ 347
METRIC RANK
16.6%
FEMALE DISABILITY
0.0/ 100
METRIC RATING
345th/ 347
METRIC RANK

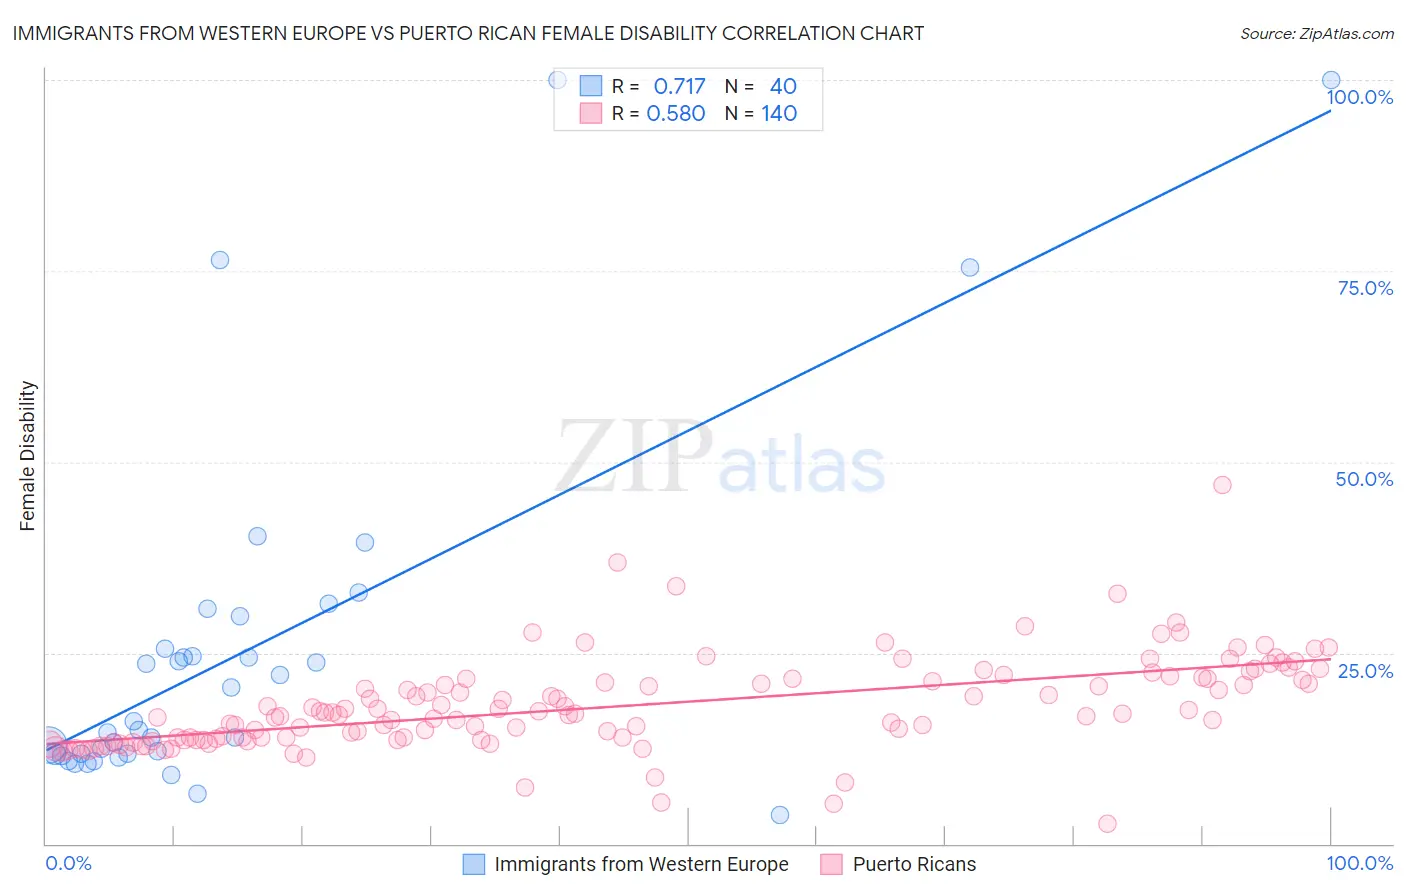
Immigrants from Western Europe vs Puerto Rican Female Disability Correlation Chart

The statistical analysis conducted on geographies consisting of 494,007,860 people shows a strong positive correlation between the proportion of Immigrants from Western Europe and percentage of females with a disability in the United States with a correlation coefficient (R) of 0.717 and weighted average of 12.2%. Similarly, the statistical analysis conducted on geographies consisting of 528,098,976 people shows a substantial positive correlation between the proportion of Puerto Ricans and percentage of females with a disability in the United States with a correlation coefficient (R) of 0.580 and weighted average of 16.6%, a difference of 35.8%.
Immigrants from Western Europe vs Puerto Rican Female Disability

Female Disability Correlation Summary

MeasurementImmigrants from Western EuropePuerto Rican
Minimum3.8%2.6%
Maximum100.0%47.0%
Range96.2%44.3%
Mean25.3%18.0%
Median15.5%16.9%
Interquartile 25% (IQ1)11.8%13.6%
Interquartile 75% (IQ3)27.7%21.5%
Interquartile Range (IQR)15.9%7.9%
Standard Deviation (Sample)23.2%6.1%
Standard Deviation (Population)22.9%6.1%

Similar Demographics by Female Disability

Demographics Similar to Immigrants from Western Europe by Female Disability

In terms of female disability, the demographic groups most similar to Immigrants from Western Europe are Immigrants from Ghana (12.2%, a difference of 0.060%), Immigrants from Guyana (12.2%, a difference of 0.080%), Immigrants from Fiji (12.3%, a difference of 0.11%), Albanian (12.3%, a difference of 0.12%), and Immigrants from Canada (12.3%, a difference of 0.15%).
DemographicsRating | RankFemale Disability
Immigrants | Southern Europe
56.3
/100
|
#171
Average
12.2%
Haitians
51.9
/100
|
#172
Average
12.2%
Immigrants | Mexico
50.8
/100
|
#173
Average
12.2%
Immigrants | England
50.0
/100
|
#174
Average
12.2%
Immigrants | St. Vincent and the Grenadines
49.7
/100
|
#175
Average
12.2%
Immigrants | Guyana
43.1
/100
|
#176
Average
12.2%
Immigrants | Ghana
42.5
/100
|
#177
Average
12.2%
Immigrants | Western Europe
40.9
/100
|
#178
Average
12.2%
Immigrants | Fiji
38.2
/100
|
#179
Fair
12.3%
Albanians
37.9
/100
|
#180
Fair
12.3%
Immigrants | Canada
37.2
/100
|
#181
Fair
12.3%
Norwegians
36.9
/100
|
#182
Fair
12.3%
Cubans
36.5
/100
|
#183
Fair
12.3%
Iraqis
36.0
/100
|
#184
Fair
12.3%
Immigrants | Uzbekistan
33.9
/100
|
#185
Fair
12.3%

Demographics Similar to Puerto Ricans by Female Disability

In terms of female disability, the demographic groups most similar to Puerto Ricans are Tsimshian (16.8%, a difference of 0.94%), Houma (16.9%, a difference of 1.7%), Kiowa (15.8%, a difference of 5.2%), Lumbee (15.8%, a difference of 5.3%), and Creek (15.7%, a difference of 6.1%).
DemographicsRating | RankFemale Disability
Immigrants | Azores
0.0
/100
|
#333
Tragic
14.9%
Cherokee
0.0
/100
|
#334
Tragic
14.9%
Cajuns
0.0
/100
|
#335
Tragic
14.9%
Seminole
0.0
/100
|
#336
Tragic
15.0%
Tohono O'odham
0.0
/100
|
#337
Tragic
15.0%
Dutch West Indians
0.0
/100
|
#338
Tragic
15.0%
Colville
0.0
/100
|
#339
Tragic
15.1%
Chickasaw
0.0
/100
|
#340
Tragic
15.2%
Choctaw
0.0
/100
|
#341
Tragic
15.4%
Creek
0.0
/100
|
#342
Tragic
15.7%
Lumbee
0.0
/100
|
#343
Tragic
15.8%
Kiowa
0.0
/100
|
#344
Tragic
15.8%
Puerto Ricans
0.0
/100
|
#345
Tragic
16.6%
Tsimshian
0.0
/100
|
#346
Tragic
16.8%
Houma
0.0
/100
|
#347
Tragic
16.9%